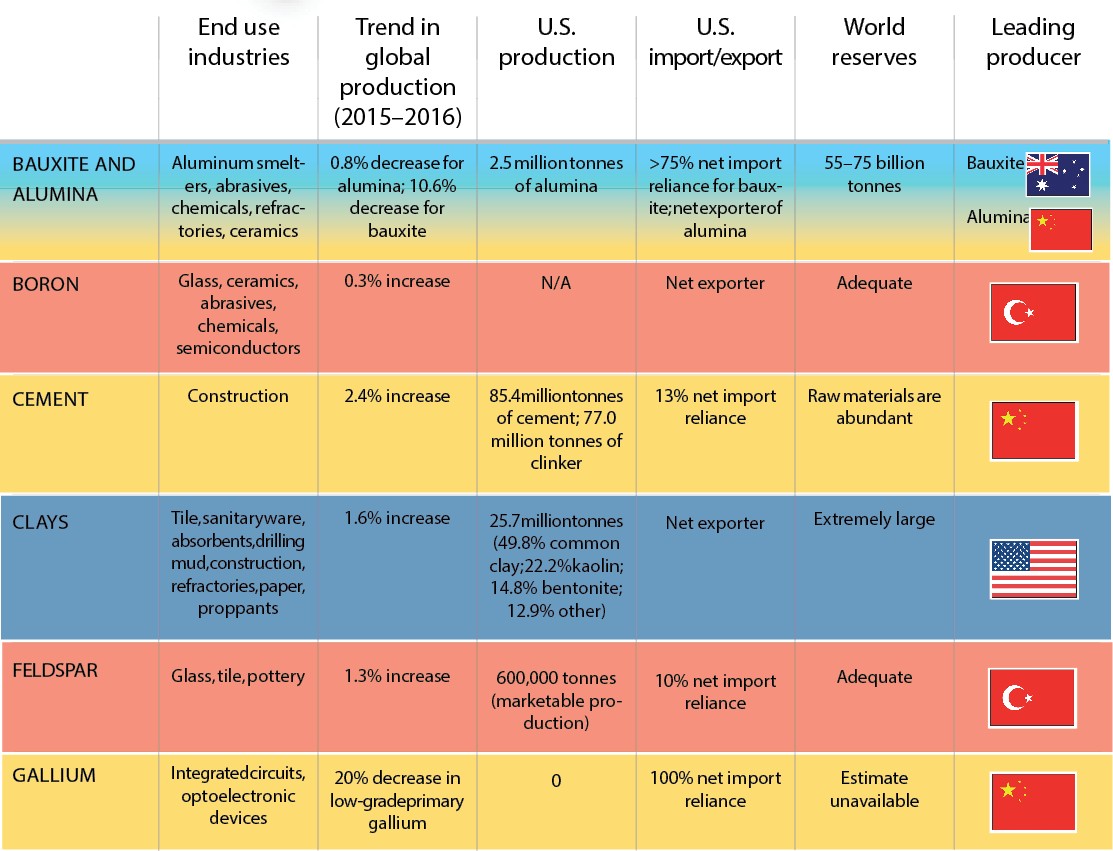
Every year, the United States Geological Survey Mineral Commodity Summaries provide an annual glimpse into the nonfuel mineral industry, complete with events, trends, and issues for more than 90 minerals and materials. And because raw materials are the starting point for all we do, every year the ACerS Bulletin provides a glimpse into the annual report by pulling out some salient statistics and trends for materials that are integral to our industry. The USGS Mineral Commodity Summaries 2017 provide data and statistics for 2016.1
Minerals contribute to U.S. gross domestic product at several levels, from mining and processing of the materials themselves up through their use to manufacture finished products. USGS estimates the value of nonfuel minerals mined in the U.S. in 2016 was $74.6 billion, up 1.6% from 2015’s total of $73.4 billion. That increase is partly the result of increased construction activity, which increased production of industrial minerals.
Beyond the mine, those raw materials in addition to domestically recycled materials were used to process $675 billion worth of mineral materials. And, in turn, these minerals were consumed by downstream industries with a value of $2.78 trillion, a 3% increase from 2015’s value of $2.69 trillion.
In general, 2016 data show an overall decline in the value of metals produced at U.S. mines, a reflection of the continuing trend from 2015 of closing of several mines and processing facilities. The value of metals produced at U.S. mines reached $23 billion in 2016, down 5% from 2015 values. Industrial minerals production reached a 2016 value of $51.6 billion, an increase of 5% over 2015 values. Thirteen mineral commodities were valued at >$1 billion in 2016, with crushed stone, cement, and construction sand/gravel leading the list.
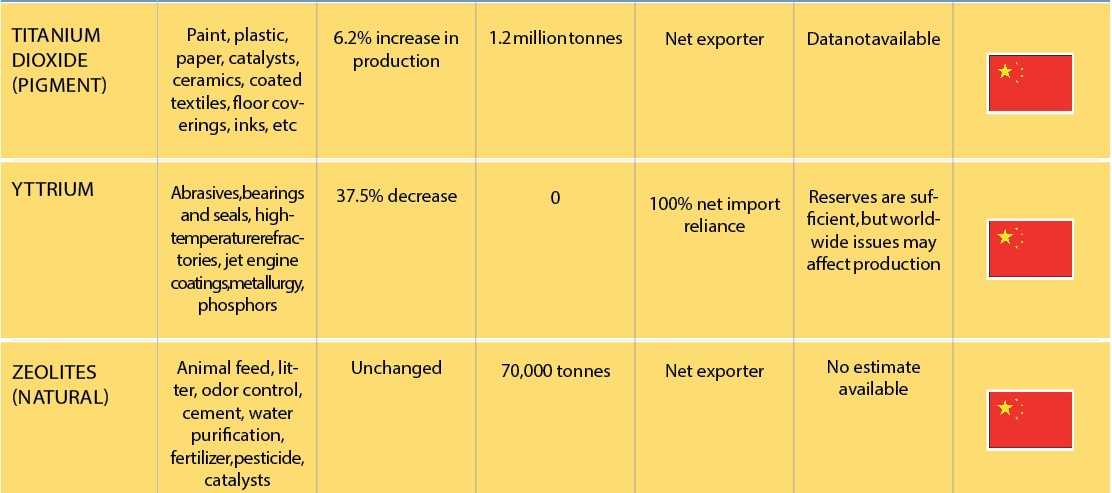
In addition to producing a variety of minerals, however, the U.S. also imported more than half of its consumption of 50 nonfuel minerals in 2016, mostly from China. Of those 50, 20 were 100% imported—arsenic, asbestos, cesium, fluorspar, gallium, graphite, indium, manganese, mica, niobium, quartz crystal, rare earths, rubidium, scandium, strontium, tantalum, thallium, thorium, vanadium, and yttrium.
Many other commodities fall somewhere along the import–export spectrum. For example, the U.S. is >50% net import-reliant on lithium, a mineral that is integral to today’s technology due to the ubiquity of lithium-ion batteries. According to a June 2017 article in The Economist, lithium demand is expected to triple by 2025.2 And because supply has not been meeting this increasing demand, lithium prices have also increased.
According to the article, higher prices are directing investors towards the “lithium triangle” of South America. This triangle—where the borders of Argentina, Bolivia, and Chile meet—contains an estimated 54% of the world’s potential lithium supply.
Although the USGS report indicates that Australia currently leads the world in production, Chile is the clear forerunner in terms of reserves—Chile contains more than double the amount of reserves than any other country on the list and accounts for more than half of the total world reserves listed.
In regards to the lithium triangle, Chile has begun to capitalize on the incredible commodity market it contains, although Argentina is just starting to realizing its potential, and Bolivia has hardly begun. These differences reflect a complex cache of factors at play in each country, including production costs, investment climate, ease of doing business, level of corruption, quality of bureaucracy, infrastructure, governmental mining regulations, and even geography. But the vast resource potential in this region indicates an imminent expansion of the lithium market in these regions.
Similar factors and climates are no doubt in play for many other commodities. What follows on the next few pages is a summary of some of the salient statistics and trends for a handful of mineral commodities that are of particular interest in the ceramic and glass industries. Readers are encouraged to access the complete USGS report at https://on.doi.gov/2siRsvg.
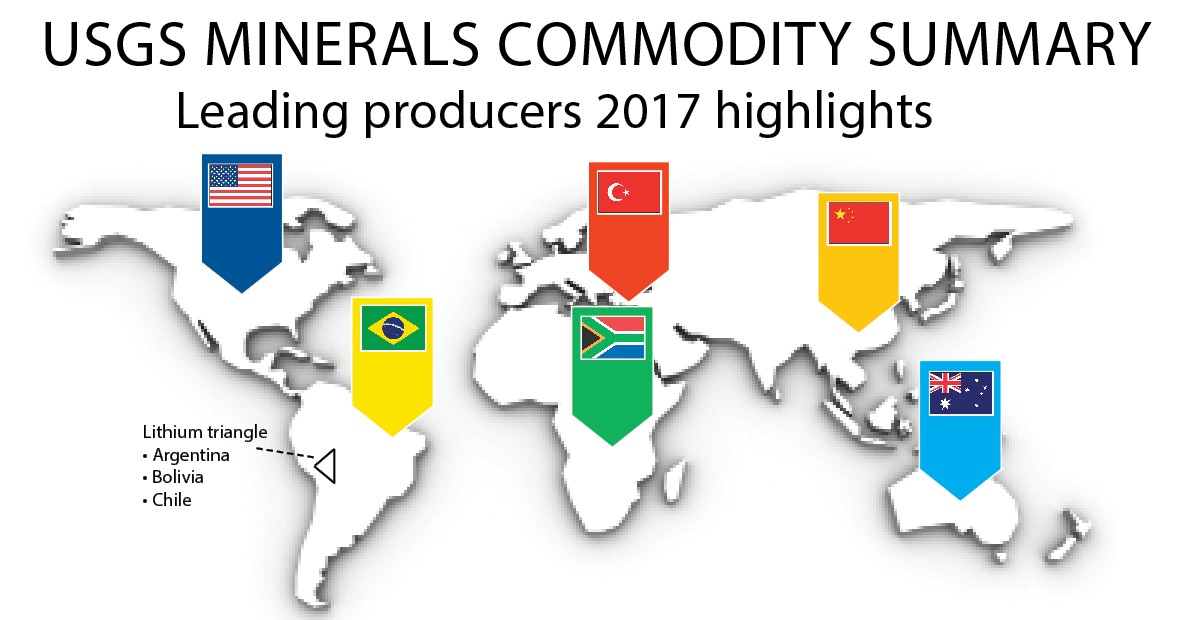
Credit: World map: iStock.com/rzdeb.
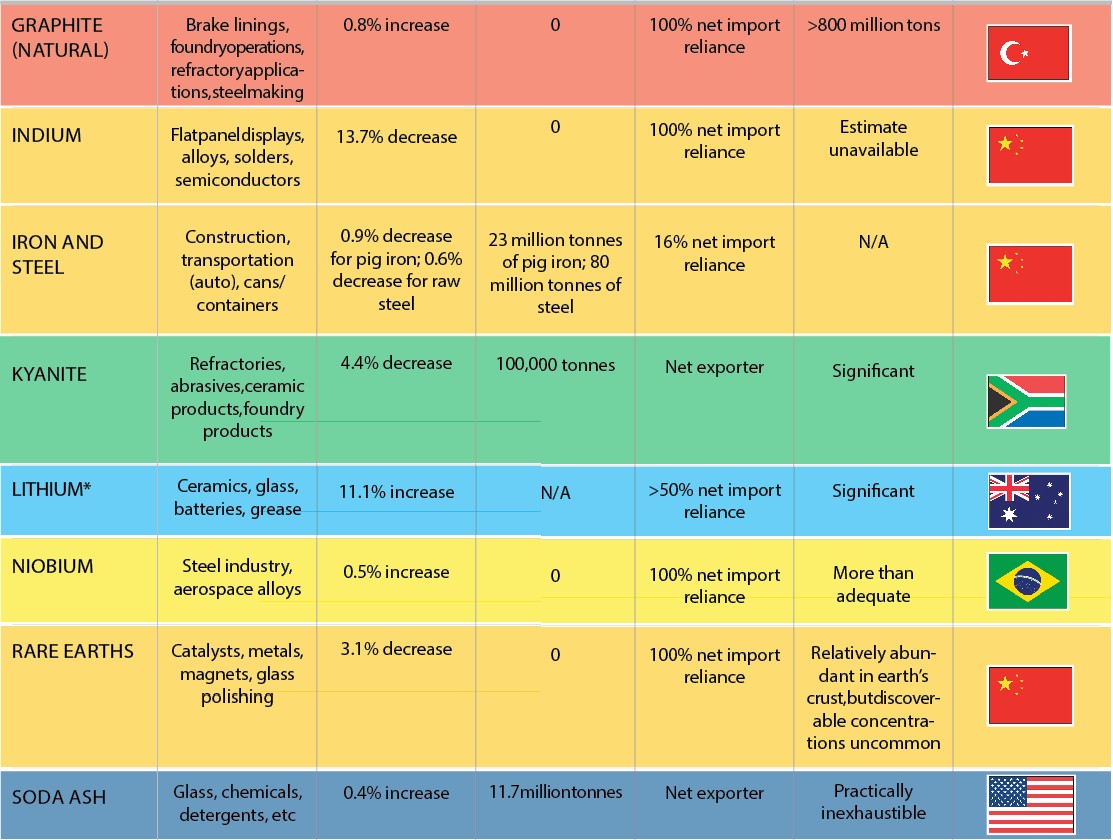
*Significant lithium reserves are also found in the lithium traingle, which includes Argentina, Bolivia, and Chile. See text above this table for further details.


Related Articles
Bulletin Features
The nonferrous metals market: Supply and regulatory pressures inspire strategies for a resilient future
Nonferrous metals serve foundational roles in the electrification, renewable energy, and digital transformation. Nonferrous metals are metals that do not contain iron in significant amounts. These metals typically are nonmagnetic, corrosion resistant, electrically and thermally conductive, and lightweight, making them ideal for applications in the emerging markets mentioned above. Even…

Market Insights
Industrial digitalization: ‘Smart’ operations can improve worker safety and well-being in high-temperature environments
Heavy industry is the backbone of economies around the world, critical to automotive production, construction, the energy sector, and everything in between. But many heavy industries are facing worker shortages. There are more than 400,000 open manufacturing jobs in the United States, according to the Bureau of Labor Statistics.1 With…

Market Insights
‘Fail fast’ manufacturing: How disciplined experimentation strengthens, not threatens, quality
In manufacturing, few phrases raise eyebrows faster than “fail fast.” In the startup world, this business strategy is celebrated as a sign of agility. On a ceramic manufacturing floor, it can sound careless or even dangerous. In manufacturing, few phrases raise eyebrows faster than “fail fast.” In the startup world,…