
$82.2 billion. That is the estimated value of total nonfuel mineral production in the United States for 2018. Put in perspective, that value is about the same amount as the fiscal year 2019 budgets of the National Institutes of Health, the National Science Foundation, and the Department of Energy combined.
This statistic is only one of many included within the annual United States Geological Survey Mineral Commodities Summaries,1 a report which provides a glimpse into the events, trends, and issues taking place in the nonfuel mineral industry.
While estimated value of total nonfuel mineral production increased by 3% from 2017 to $82.2 billion in 2018, total value of industrial minerals production saw an increase of 7% to $56.3 billion. Of this total, $25.3 billion came from construction aggregates production, mainly crushed stone, 30%; cement, 20%; and construction sand and gravel, 15%.
The year 2018 saw a large number of import duties being levied by the U.S. and against the U.S. in retaliation, beginning with the U.S. enacting additional import duties of 10% and 25% for aluminum articles and steel articles, respectively, in March. In July, a list of 818 tariff lines became subject to an additional import duty of 25%, and in August, a second list of 279 tariff lines was added. In late September, a third list of 5,745 full and partial tariff lines, including nonfuel mineral ores and concentrates and forms, became subject to an additional 10% import duty. Other countries, most notably China, responded to these import duties by adding products of U.S. origin to their list of higher import duties.
The tariffs are significantly affecting a number of industries, particularly manufacturers and farmers. A Reason article2 from last year gave a list of companies affected by the tariffs, including Alcoa, which cut its profit forecast ranges by $500 million; General Electric, which faces up to $400 million a year in tariff-induced costs; and Ford, which faces up to $300 million in extra costs.
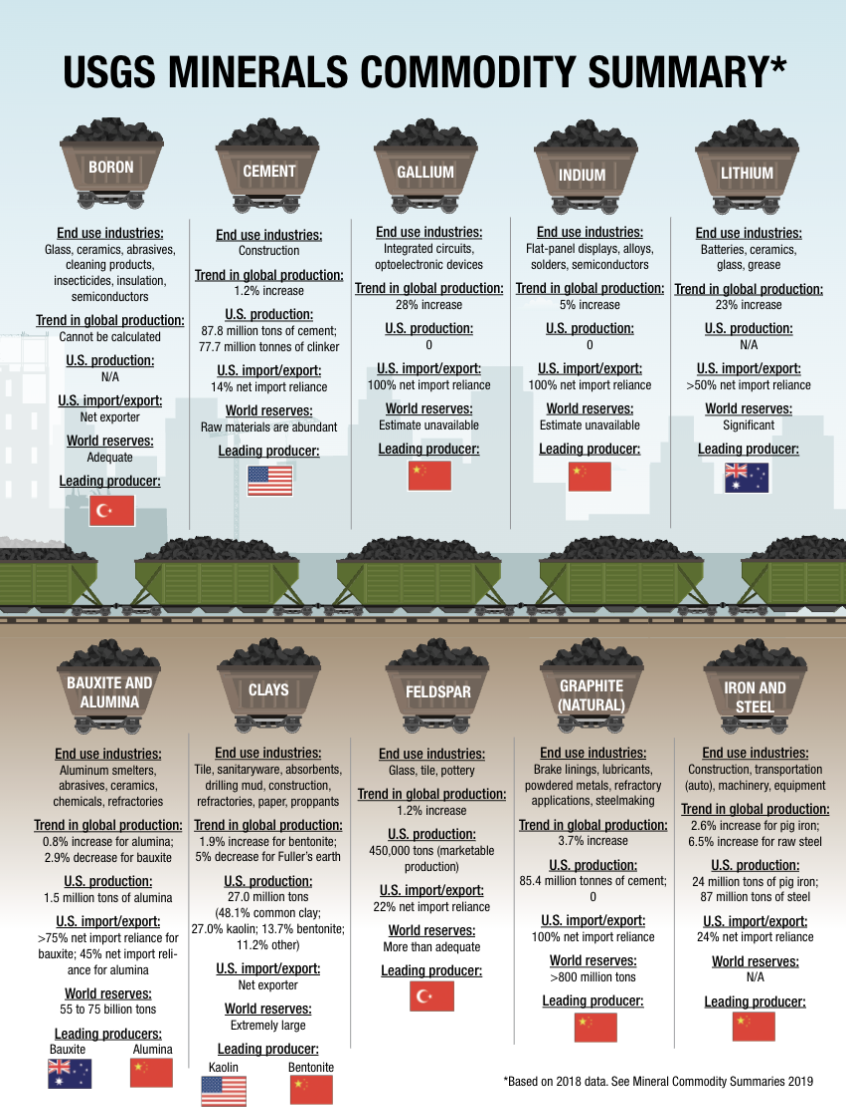
The U.S. ultimately removed a few commodities from the proposed tariff lists because they are critical materials. Of the 35 minerals or mineral material groups identified as critical, the U.S. was 100% net import reliant for 14 of them—arsenic, cesium, fluorspar, gallium, graphite (natural), indium, manganese, niobium, rare earth elements group, rubidium, scandium, strontium, tantalum, and vanadium.
Many of these critical materials come from China. As American Elements chairman and CEO Michael Silver explained in a Wall Street Journal article,3 around 96% of global mining output for rare-earth metals comes from within China’s borders. It is no surprise, then, that China, followed by Canada, supplied the largest number of nonfuel mineral commodities in 2018.
However, China does face supply shortages of their own. In an “IMFORMD insights” column4 from the March 2019 ACerS Bulletin, IMFORMD director Mike O’Driscoll discussed how a range of factors arising in 2017 and spilling into 2018 significantly compounded the shortage of key refractory and other mineral exports from China, a crisis that continues into 2019.
What follows on the next two pages summarizes salient statistics and trends for a handful of mineral commodities of particular interest in the ceramic and glass industries. Readers are encouraged to access the complete USGS report at https://on.doi.gov/2siRsvg


Related Articles

Bulletin Features
The nonferrous metals market: Supply and regulatory pressures inspire strategies for a resilient future
Nonferrous metals serve foundational roles in the electrification, renewable energy, and digital transformation. Nonferrous metals are metals that do not contain iron in significant amounts. These metals typically are nonmagnetic, corrosion resistant, electrically and thermally conductive, and lightweight, making them ideal for applications in the emerging markets mentioned above. Even…

Market Insights
Industrial digitalization: ‘Smart’ operations can improve worker safety and well-being in high-temperature environments
Heavy industry is the backbone of economies around the world, critical to automotive production, construction, the energy sector, and everything in between. But many heavy industries are facing worker shortages. There are more than 400,000 open manufacturing jobs in the United States, according to the Bureau of Labor Statistics.1 With…

Market Insights
‘Fail fast’ manufacturing: How disciplined experimentation strengthens, not threatens, quality
In manufacturing, few phrases raise eyebrows faster than “fail fast.” In the startup world, this business strategy is celebrated as a sign of agility. On a ceramic manufacturing floor, it can sound careless or even dangerous. In manufacturing, few phrases raise eyebrows faster than “fail fast.” In the startup world,…