
Continued tariffs, new trade agreements, increased production values—this year brought different successes and challenges for the nonfuel mineral industry, all of which are captured in the annual United States Geological Survey Mineral Commodity Summaries report.1
The Mineral Commodity Summaries spotlights the events, trends, and issues that took place the previous year in the nonfuel mineral industry. And because raw materials are what make our high-tech world possible, every August the ACerS Bulletin provides a look at some of the key facts covered in the report, including statistics on production, supply, and overall market for more than 90 minerals and raw materials.
The estimated value of total nonfuel mineral production in 2019 increased by 3% from 2018 to $86.3 billion. The total value of industrial minerals production increased by 3% as well, to $58.2 billion. Of this total, $27.7 billion came from construction aggregates production. Crushed stone accounted for the largest share of total U.S. nonfuel mineral production value in 2019 with 22%.
Trade wars started in 2018 continued in 2019, with various import duties being either newly levied, continued, or removed. In May, the U.S., Canada, and Mexico reached an agreement on trade terms, resulting in the removal of the ad valorem duties for aluminum and steel imports on Canada and Mexico. Also in May, the U.S. and China failed to reach an agreement, which resulted in the U.S. increasing tariffs for List 3 items to 25% and China imposing additional import duties for certain items. In December, a phase one trade agreement was reached between the U.S. and China, which reduced some tariff rates and resulted in additional tariffs not being implemented.
Since Executive Order 13817 was issued in December 2017, the federal government has made several steps toward ensuring secure and reliable supplies of critical minerals in the U.S. In May 2018, a final list of critical minerals was published in the Federal Register, which included 35 minerals or mineral material groups. In June 2019, the U.S. Department of Commerce issued a report2 containing six calls to action, 24 goals, and 61 recommendations that describe specific steps the U.S. government will take to achieve objectives outlined in the executive order.
The U.S. continues to rely on foreign sources for raw and processed mineral materials. In 2019, imports made up more than one-half of the U.S. apparent consumption for 46 nonfuel mineral commodities, and the U.S. was 100% net import reliant for 17 of those. In terms of critical minerals, these minerals comprised 14 of the 17 mineral commodities with 100% net import reliance and comprised 17 of the 29 remaining mineral commodities with imports greater than 50% of annual consumption. In line with previous years, China and Canada supplied the largest and second largest number of nonfuel mineral commodities, respectively.
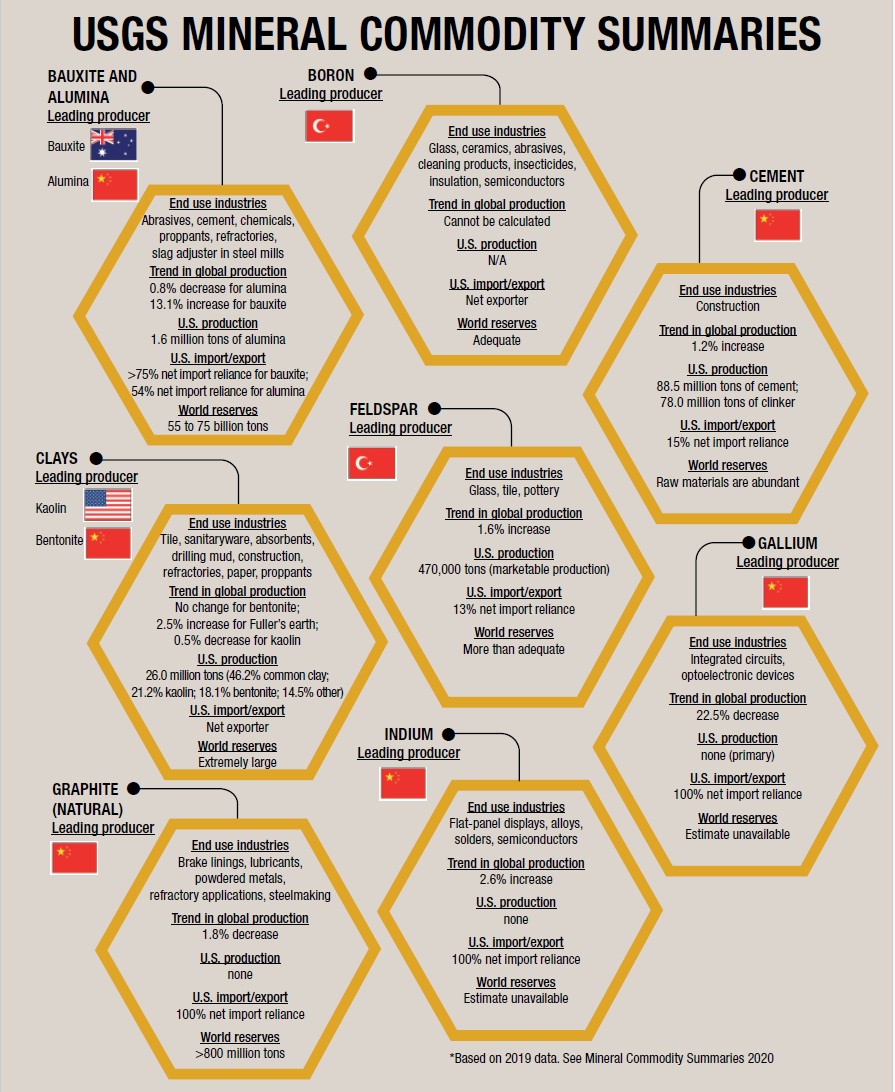
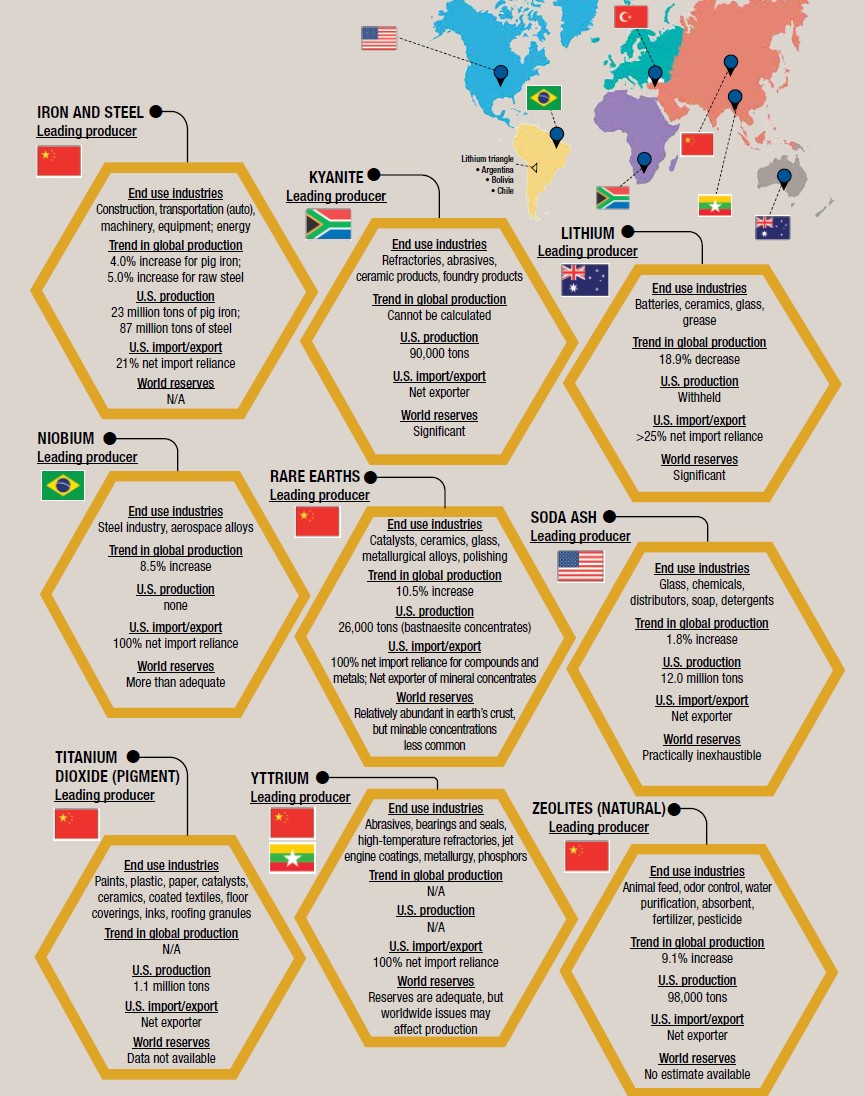
Below, an infographic summarizes some of the salient statistics and trends for a handful of mineral commodities that are of particular interest in the ceramic and glass industries. Readers are encouraged to access the complete USGS report at https://doi.org/10.3133/mcs2020.


Related Articles

Bulletin Features
The nonferrous metals market: Supply and regulatory pressures inspire strategies for a resilient future
Nonferrous metals serve foundational roles in the electrification, renewable energy, and digital transformation. Nonferrous metals are metals that do not contain iron in significant amounts. These metals typically are nonmagnetic, corrosion resistant, electrically and thermally conductive, and lightweight, making them ideal for applications in the emerging markets mentioned above. Even…

Market Insights
Industrial digitalization: ‘Smart’ operations can improve worker safety and well-being in high-temperature environments
Heavy industry is the backbone of economies around the world, critical to automotive production, construction, the energy sector, and everything in between. But many heavy industries are facing worker shortages. There are more than 400,000 open manufacturing jobs in the United States, according to the Bureau of Labor Statistics.1 With…

Market Insights
‘Fail fast’ manufacturing: How disciplined experimentation strengthens, not threatens, quality
In manufacturing, few phrases raise eyebrows faster than “fail fast.” In the startup world, this business strategy is celebrated as a sign of agility. On a ceramic manufacturing floor, it can sound careless or even dangerous. In manufacturing, few phrases raise eyebrows faster than “fail fast.” In the startup world,…