
The ceramic and glass industry cuts a wide swath across industries producing commodity products, such as brick, tile, and glass containers; to components, such as fasteners, multilayer capacitors, and armor; to highly engineered products, such as optical fibers, medical devices, jet engine components, and display glass for consumer electronics. The spectrum of applications along the way is densely packed.
Analysts categorize “the ceramic industry” into advanced technical ceramics and traditional ceramics (Figure 1). However, those in the industry recognize that the “traditional” industries, such as refractories and glass, produce highly engineered, innovative products that arguably qualify as advanced technical ceramics.
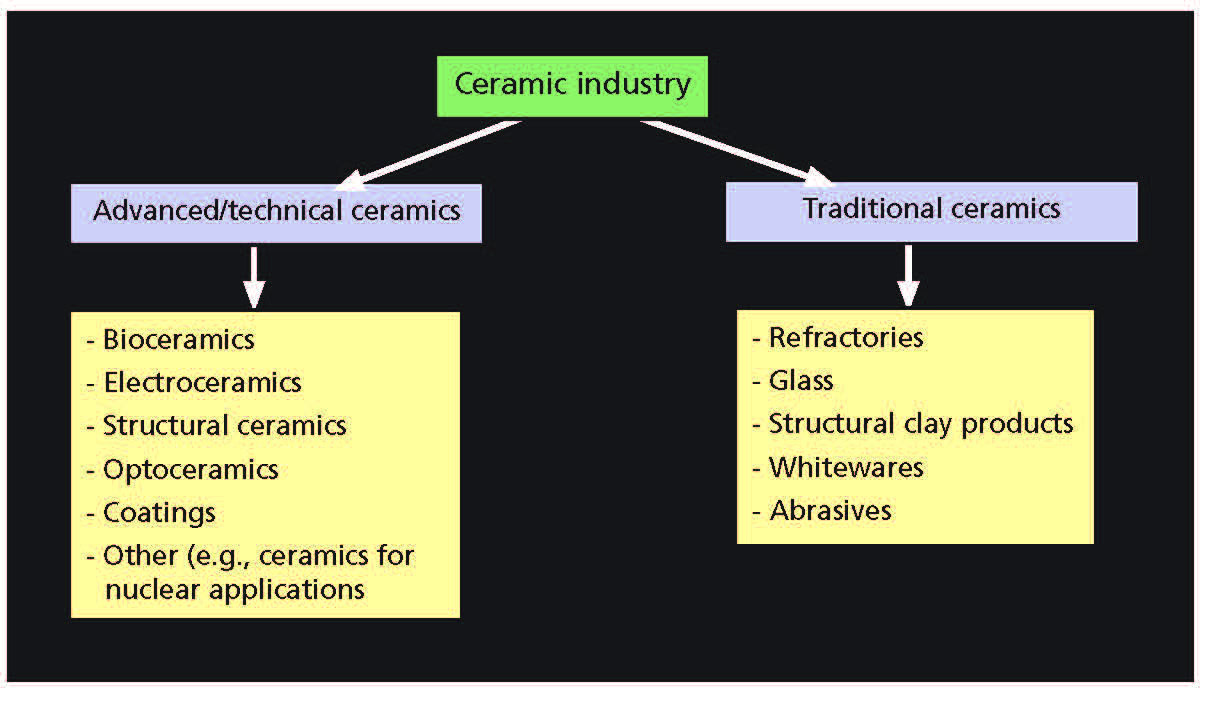
Figure 1. Typical categorization of the ceramic industry. Credit: Gagliardi
Specifically, the global advanced technical ceramic market was valued at $56.70 billion in 2015, according to a June 2016 analysis conducted by Grand View Research that looked internationally at product, application, and end-use projections through 2024.2 The report covers markets for alumina, titanate, zirconate, and ferrite components (among other ceramic materials) in monolithic ceramics, ceramic coatings, and ceramic-matrix composites for electronic, automobile, machinery, environmental technologies, and medical applications.
“Numerous players are expected to increase their R&D expenditure to comply with growing demand from new applications, and most companies have been trying to improve their operations at a reduced cost, which in turn is expected to boost product market over the next eight years,” the report states.
Another recent report from BCC Research estimates that the North American market alone for advanced technical ceramics was $4.5 billion in 2015 and projects it will grow to $6.7 billion by 2020, a compounded annual growth rate (CAGR) of 6.7% for the five-year span. Figure 2 shows how several sectors of the market are expected to contribute to the projected growth.3
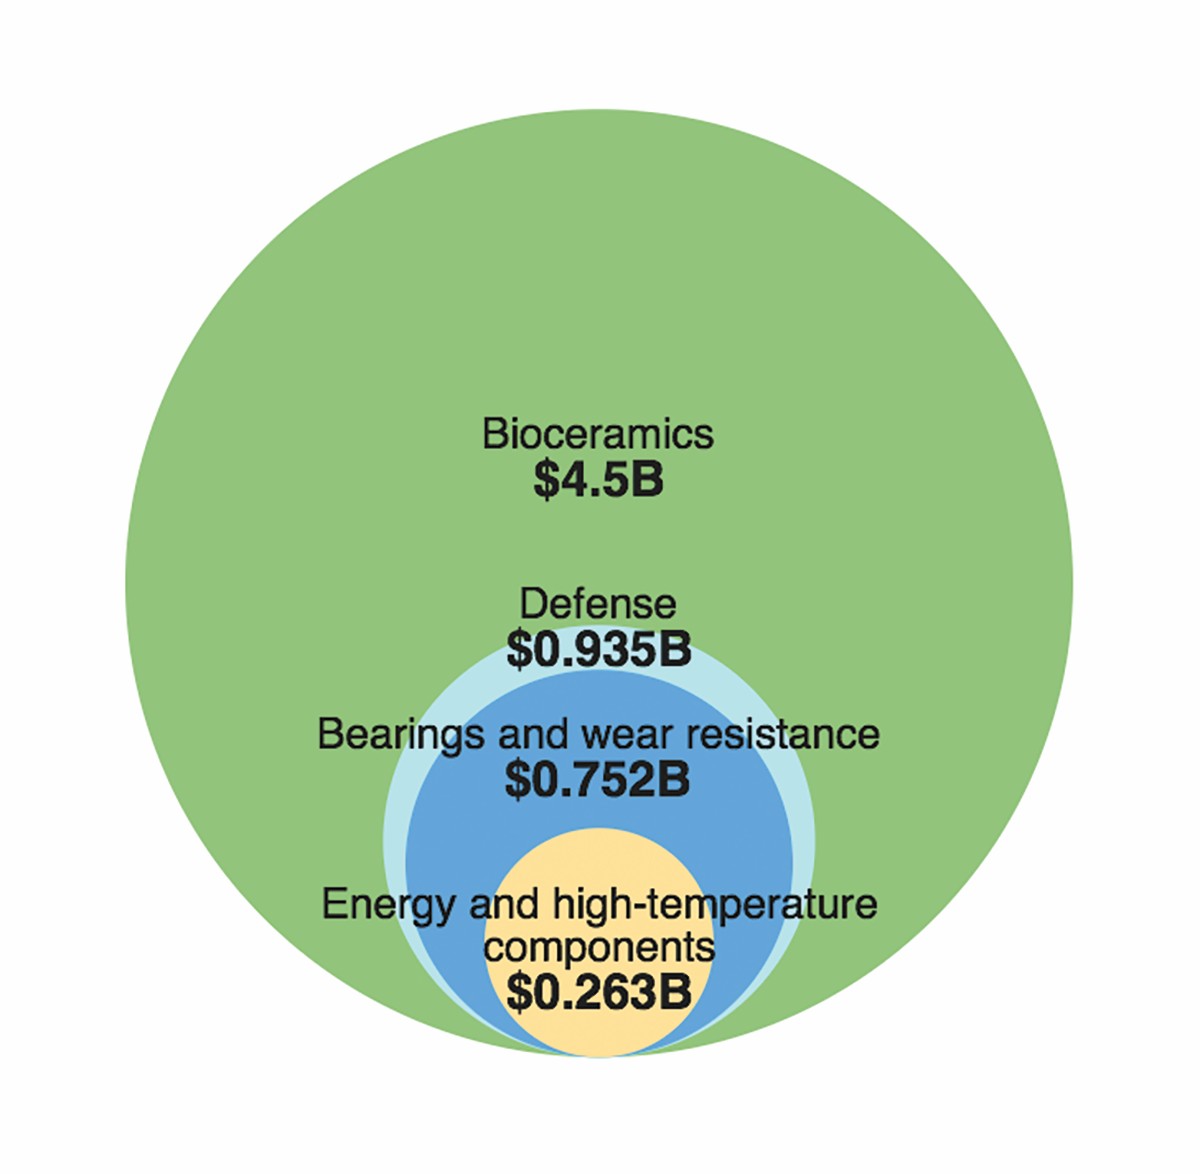
Figure 2. Market segments expected to contribute to the growth of the North American advanced technical ceramic market. Projected market values by 2020 from Reference 3. Credit: ACerS
The aerospace industry provides an illustration of how an industry drives significant revenues across its supply chain, including ceramics. According to one report, global sales of gas-turbine engines in 2015 reached about $39 billion. Projecting out to 2028, domestic and military aircraft are estimated to generate sales of $1.07 trillion through 2028.4
Protective coatings—thermal barriers and environmental barriers—comprise one critical component of gas-turbine engines that use ceramic materials. The global ceramic coatings market, which includes aircraft applications, is estimated to reach $9.07 billion in 2020,5 with about $1.9 billion contributed by the North American market.6 Also, GE-Safran’s much-anticipated LEAP engine with a 3-D-built ceramic-matrix composite component was introduced in fall 2016. GE’s website says the company already has booked more than 6,000 orders valued in excess of $78 billion.7
In the future, new processes, such as additive manufacturing and polymer-derived ceramics, will lead to novel materials and novel forms. The projected market for 3-D-printed ceramic components of $131.5 million by 2021 reflects an industry continuing to learn how to use the technology. However, this projection represents a 29.6% CAGR, evidence of optimism in the industry for great opportunity.8 Function will follow form as applications emerge for monolithic, composite, porous, fiber, or coating form factors.
Newly established events and initiatives dedicated to furthering technological advances in functional ceramics have gained traction over the past few years, drawing attention to the field and industry growth. Now in its third year, Ceramics Expo has secured its place as the annual event in North America that brings together companies and organizations that produce and rely on ceramic technologies. The American Ceramic Society also created The Ceramic and Glass Industry Foundation in 2014 to attract, inspire, and train the next generation of ceramic and glass professionals.
These factors signal a vibrant industry, but what specifically is driving growth and what will the future bring? The following profile examines industry indicators in the United States, including employment and output projections, manufacturing trends, and current priorities for the federal budget in FY 2017 when it comes to clean energy, emerging technologies, and transportation. The profile also looks at two specific ceramic sectors and reports recent revenue for some of the industry’s heaviest hitters.
Broader industry indicators signal mildly optimistic manufacturing forecast
The Institute for Supply Management (ISM) is a worldwide professional supply management organization that provides economic indicators through its monthly publication, Report on Business. Based on a survey of manufacturing supply executives across a variety of industries, the report provides a general measure of the state of manufacturing and nonmanufacturing industries in the U.S., quantified as a Purchasing Manager’s Index (PMI).
Although the figures are U.S.-centric, global manufacturers follow PMI scores, because they provide a snapshot of the overall economy and of the status of segmented industries. According to ISM, PMI scores “have been consistently accurate in indicating the direction of the overall economy in addition to the manufacturing and nonmanufacturing sectors.”9 Scores are provided as a percentage—scores greater than 50% indicate expansion, whereas scores less than 50% signal contraction.
ISM’s most recent manufacturing PMI registered 51.5% in September 2016, with reported growth in seven separate industries, including nonmetallic mineral products.10 Average PMI during the past 12 months is 50.3%, and average PMI during the past four years is 52.9% (Figure 3). ISM indicates that consistent PMI scores greater than 43.2% indicate overall economic expansion—by that measure, the latest score is the 88th consecutive month of expansion in the manufacturing sector, according to ISM.
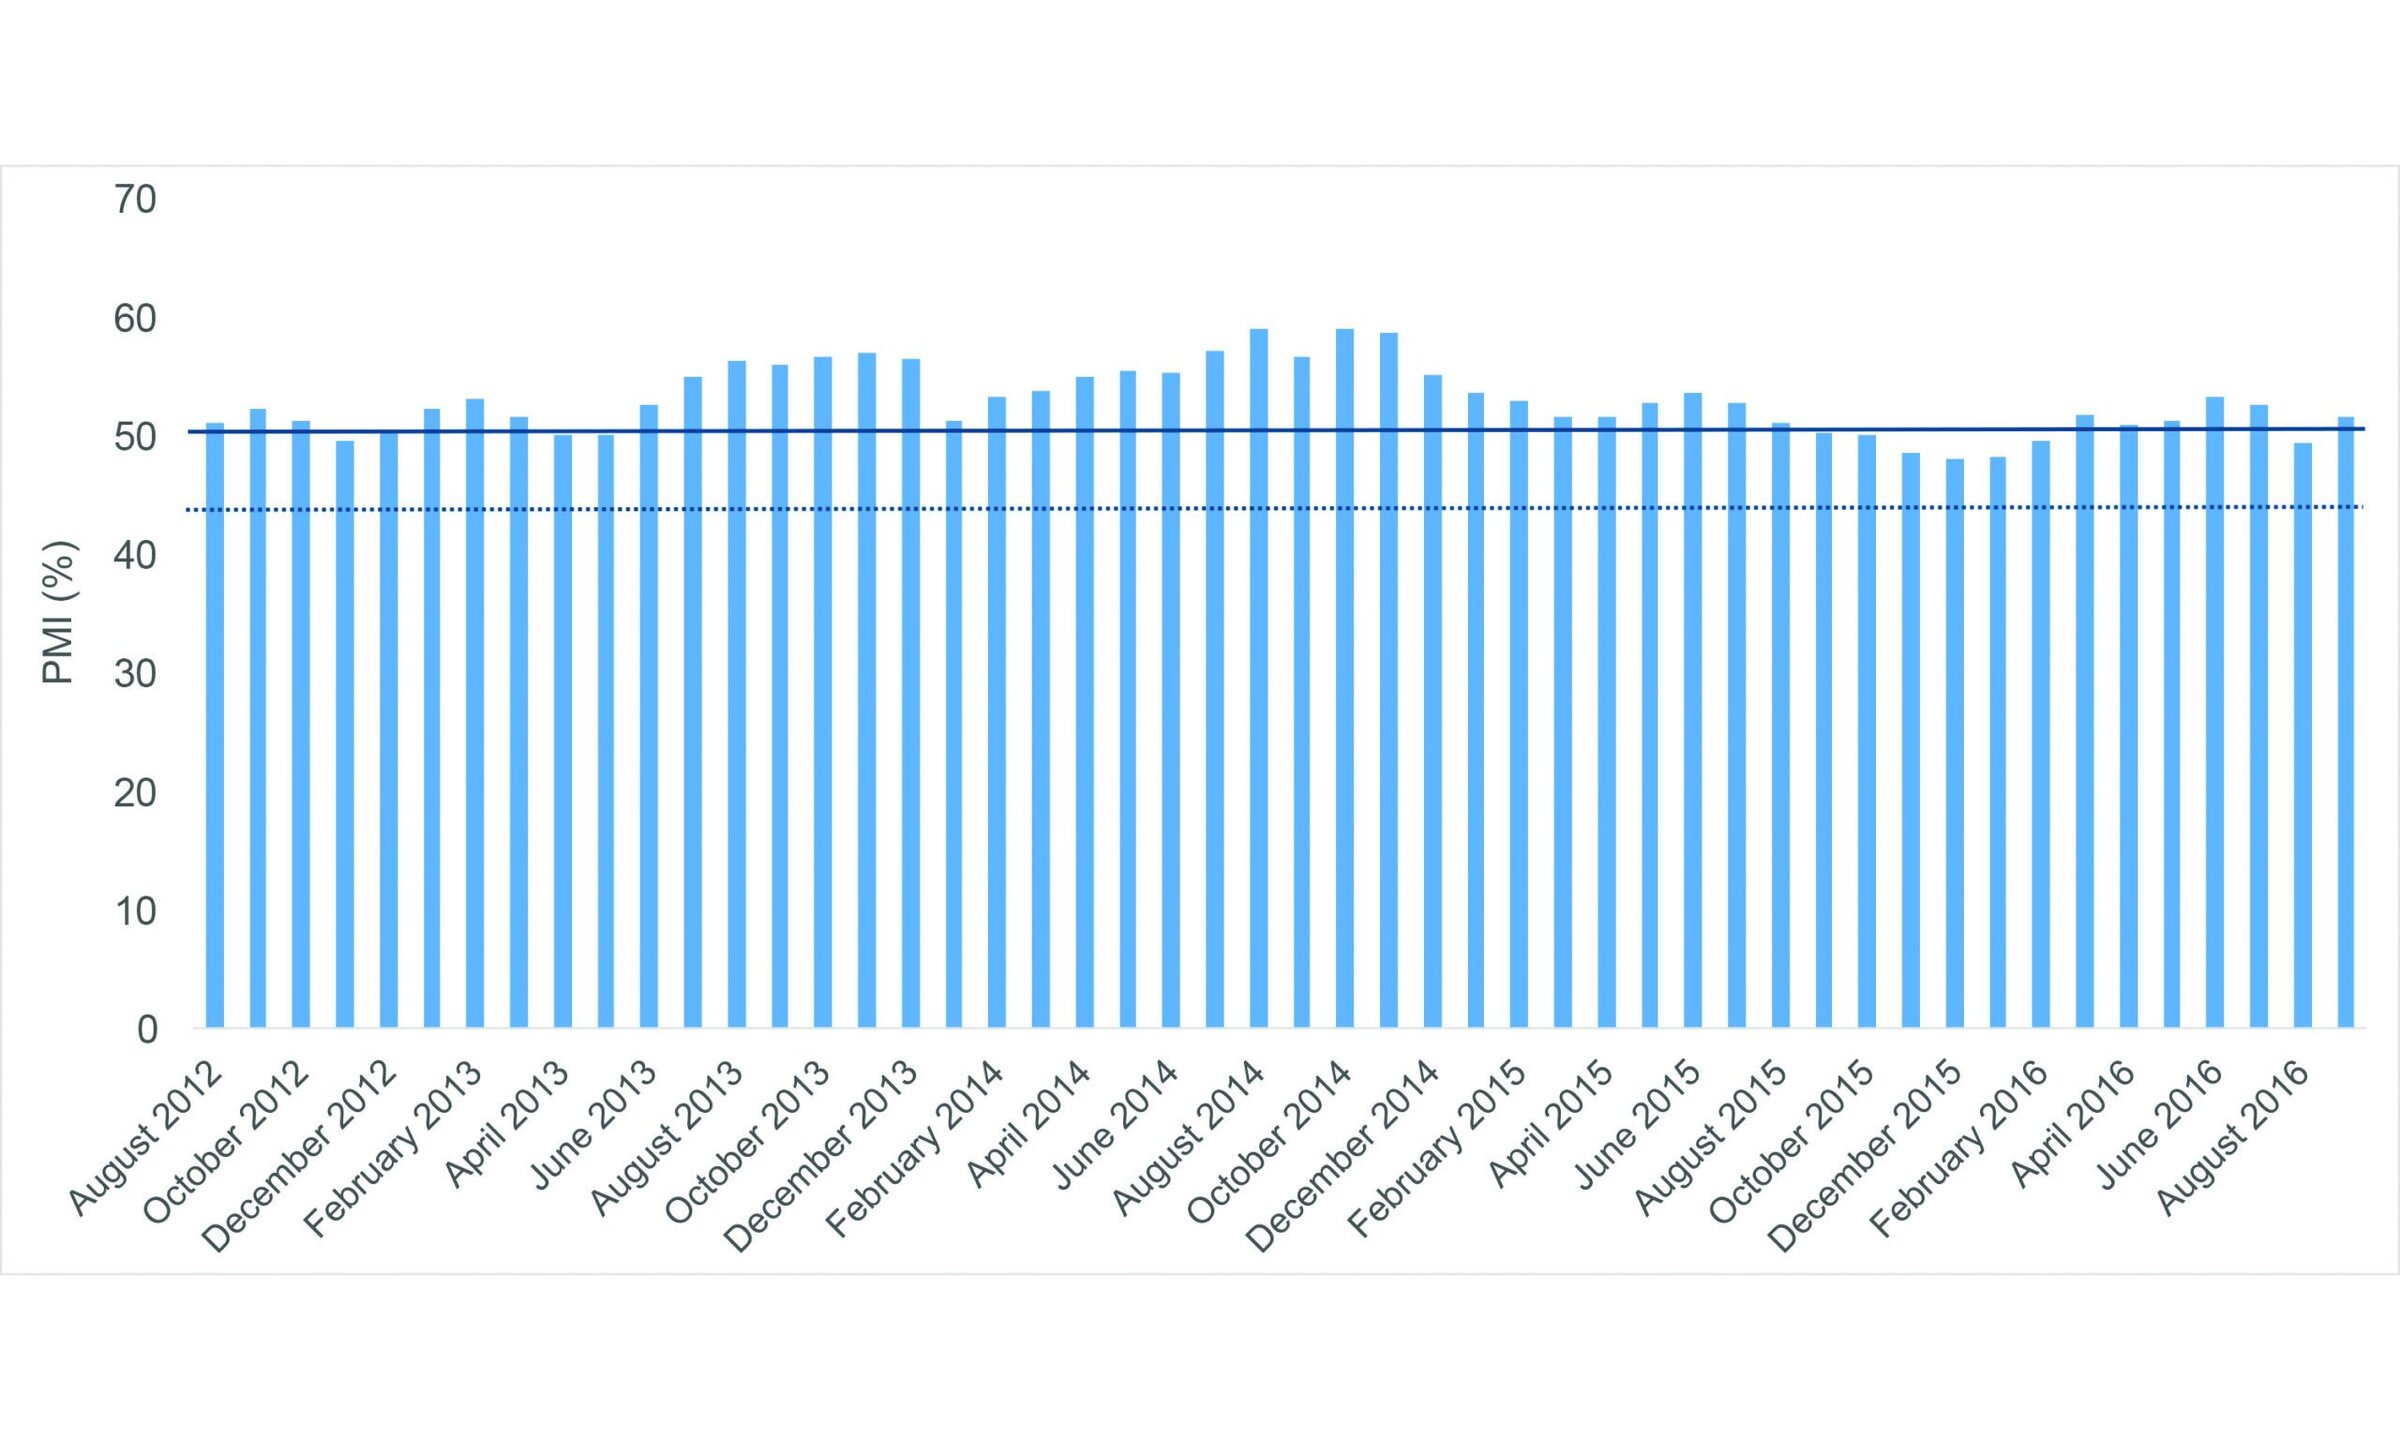
Figure 3. ISM U.S. manufacturing PMI scores from August 2012 to September 2016. Scores greater than 50% (solid line) indicate expansion, whereas scores less than 50% indicate contraction. Consistent PMI scores greater than 43.2% (dotted line) indicate overall economic expansion. Data from Reference 11. Credit: ACerS
To complement the ISM PMI scores, the U.S. Department of Labor’s Bureau of Labor Statistics (BLS) tracks and publicly releases detailed economic information related to the U.S. labor market. This data-rich source of information provides overall and individual snapshots of metrics detailing employment and productivity for individual sectors, which can signal the overall health of those industries. Data come from the BLS Current Employment Statistics survey, which includes approximately 146,000 businesses and government agencies representing all 50 states.
BLS issues biennial data projections by industry, identifying sectors according to the North American Industry Classification System (NAICS) (see bottom of page). According to statistics published in the December 2015 Monthly Labor Review, there is tempered optimism for the future: “With this set of biennial 10-year projections, the BLS presents a view of an economy that is returning to a more consistent growth path, but the growth is slower than the long-term trends that existed prior to the Great Recession.”12
Overall, BLS predicts total U.S. employment will reach 160.3 million by 2024, representing a 0.6% CAGR. Productivity projections predict that overall U.S. output will reach $34.6 trillion in 2024, a 2.2% average annual increase from 2014 figures. Output has increased on average 1.0% annually from 2004 to 2014.
BLS further breaks its employment and output statistics into four main areas: goods-producing sectors (excluding agriculture); service-providing sectors; agriculture, forest, fishing, and hunting; and nonagricultural self-employed. The goods-producing sector is divided into mining, construction, and manufacturing.
Employment and output statistics for 2004–2014 and projections for 2014–2024 for the mining, construction, and manufacturing industries are shown in Table 1. Slow employment growth in mining is largely caused by uncertainty regarding future oil prices—increased horizontal drilling, hydraulic fracturing, and offshore exploration are expected to contribute to the increase in mining output.
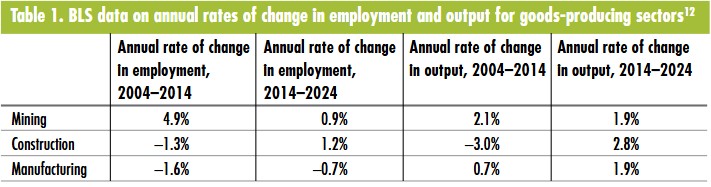
Data from Reference 12. Table created by ACerS.
The construction industry is predicted to add the most jobs to the goods-producing sector from 2014 to 2024, but will not reach prerecession levels, the report notes. Construction output, like construction employment, is expected to be fastest growing within the goods-producing sectors, with a growth rate that outpaces overall economic growth. Growth in residential and nonresidential investments is expected to contribute to the heightened output, with nonresidential investments finally getting back on track to surpass prerecession numbers by 2024.
Manufacturing jobs are projected to decline, but manufacturing output is expected to grow from 2014 to 2024. How can that be? According to the report, “Although manufacturing employment is projected to fall, real output in the manufacturing sector is expected to grow 1.9% annually to reach almost $6.6 billion in 2024, up from more than $5.4 billion in 2014. … Increased productivity—because of automation, contract manufacturing, and a more efficient manufacturing process in most industries—will lead to more real output with fewer employees required.”
In addition to the decrease in available skilled manufacturing jobs, the remaining jobs are shifting focus. Although this shift introduces challenges for skilled laborers, the changes could signal new growth opportunities for the manufacturing sector. The report continues, “Over the past few decades, manufacturing plants have become more automated, thus requiring skills that are more technical. For example, computer programmers and coders are needed by manufacturers, as are people to design and run the machines.”
The manufacturing division within the goods-producing sectors is further divided into specific manufacturing industries, again following NAICS code designations. NAICS code 327, manufacturing of nonmetallic mineral products, covers much of our industry’s outputs (see sidebar for more information).
Nonmetallic mineral product manufacturing
Manufacturing of nonmetallic mineral products experienced an annual decline of 1.3% in output from 2004 to 2014, but is expected to grow at a rate of 1.8% from 2014 to 2024. All four divisions within this category—clay product and refractories; glass and glass products; cement and concrete products; and lime, gypsum, and other products—are expected to increase output from 2014 to 2024, with the greatest gain in cement and concrete product manufacturing at a 2.5% annual rate of change.
The U.S. Census Bureau’s Annual Survey of Manufactures provides estimated statistics for U.S. manufacturing establishments based on a sample survey of approximately 50,000 establishments selected from the most recent Economic Census.13 The most recent survey from 2014 provides, among much more data, statistics on the total value of products shipped, broken down by NAICS codes.
Total value of shipments of nonmetallic mineral products overall grew 26% from 2010 to 2014. Values of clay products and refractories shipments increased 15%; glass and glass products increased 20%; cement and concrete products increased 25%; and lime, gypsum, and other products increased 45% (Figure 4).
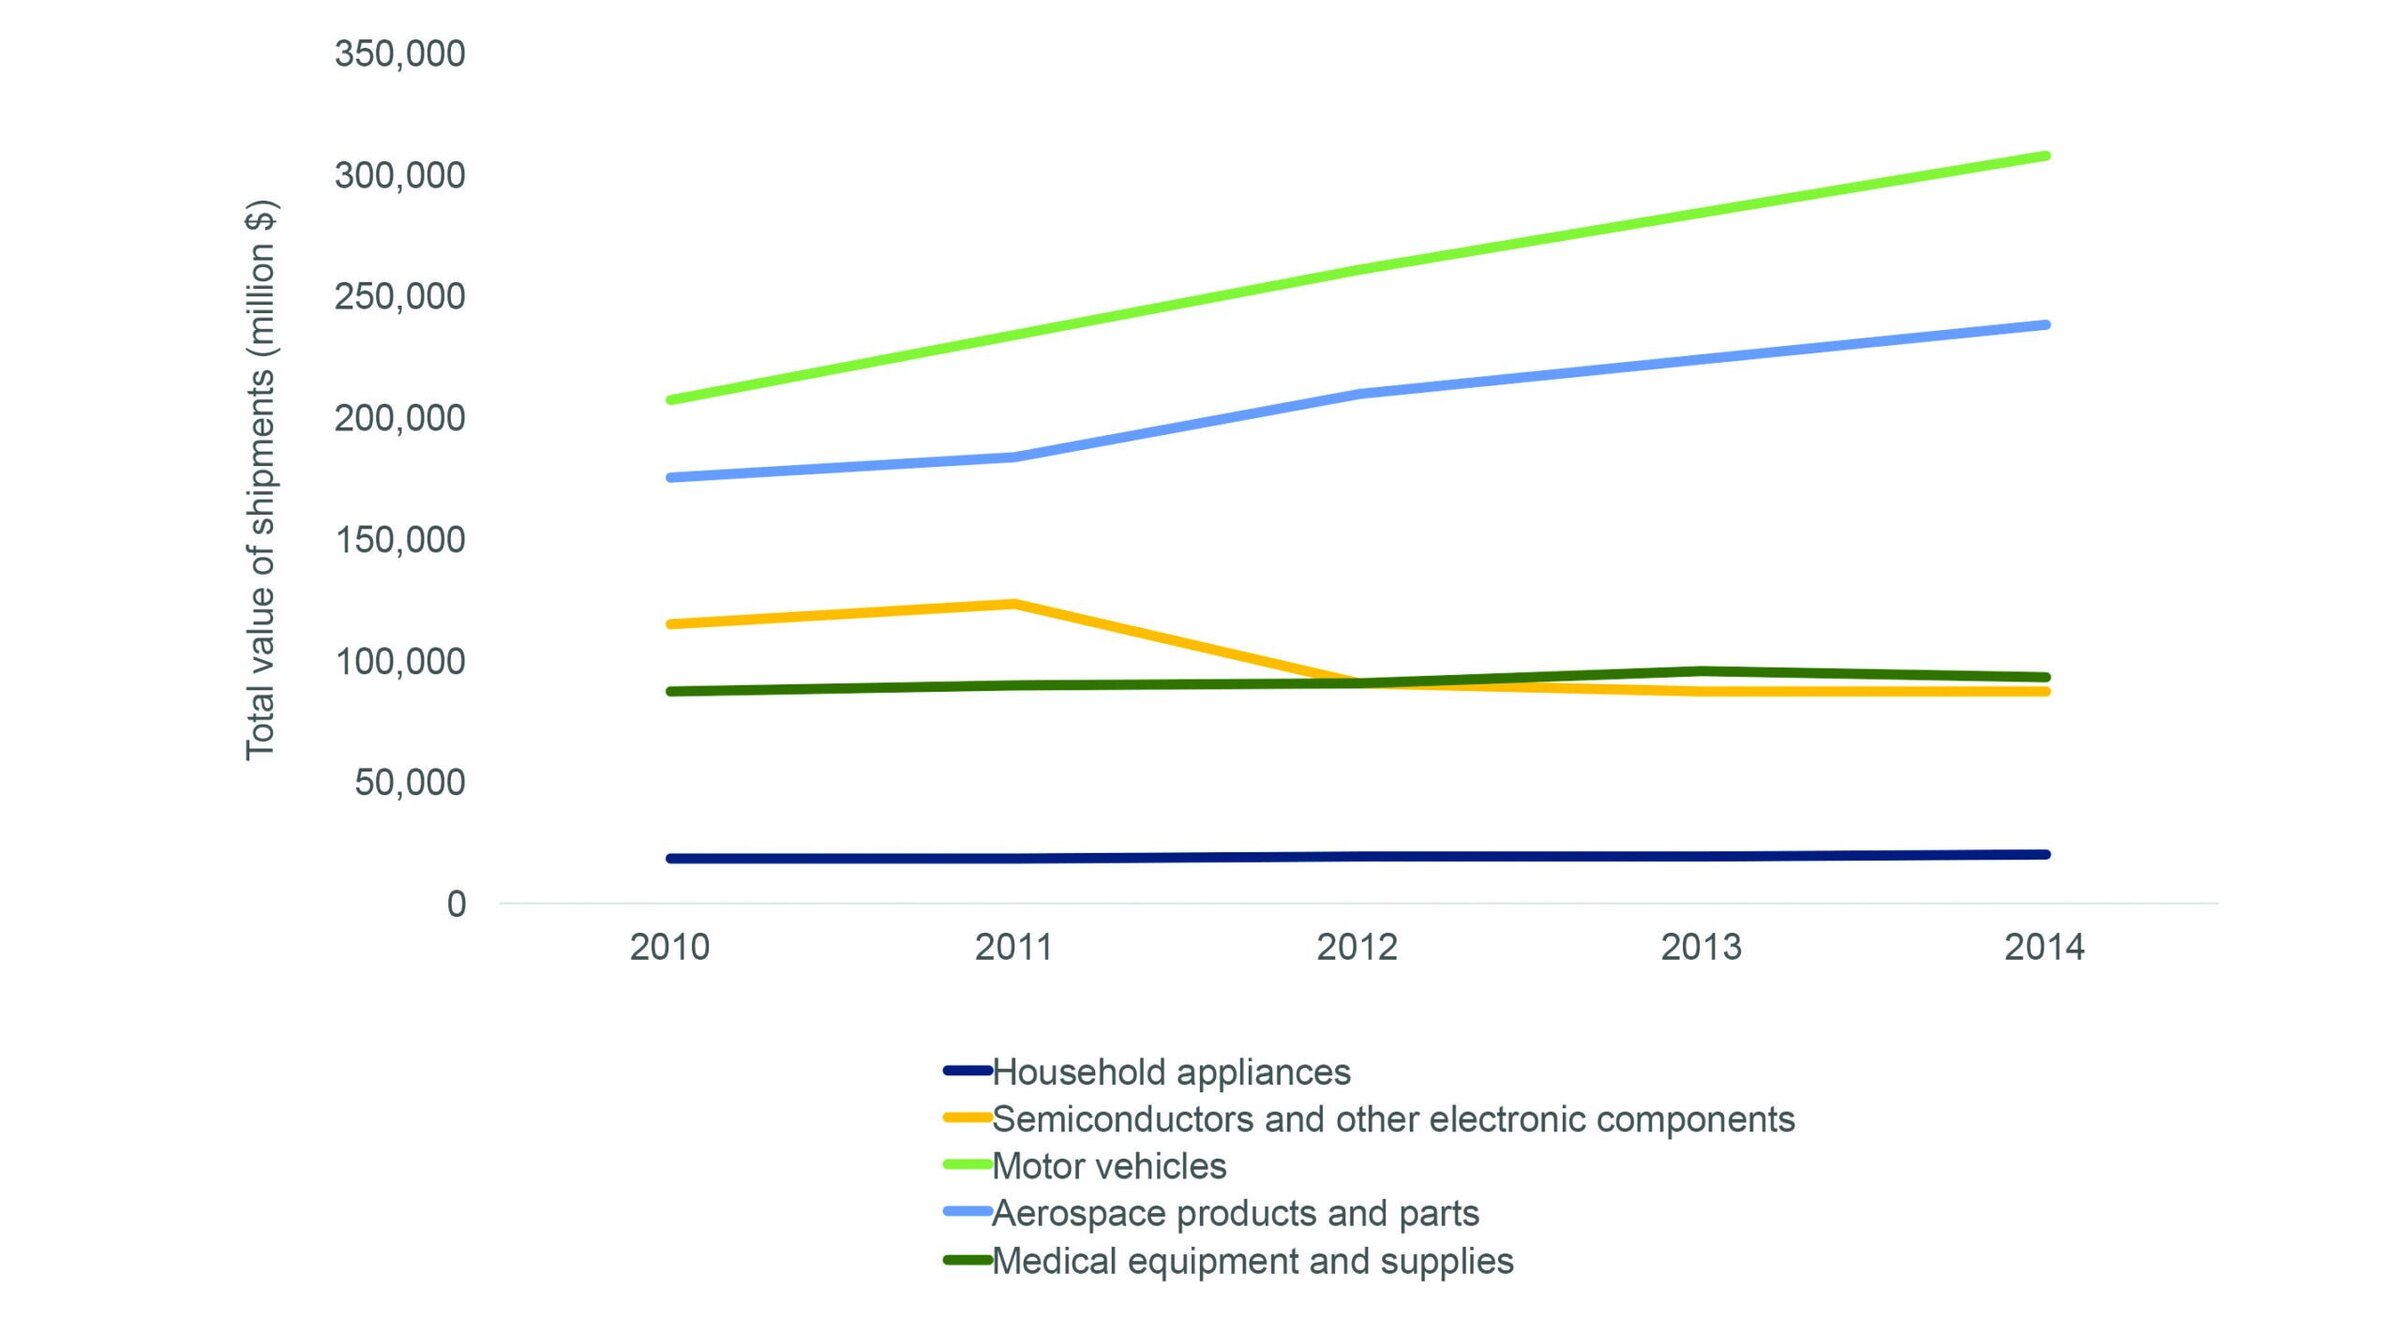
Figure 4. Total value of products shipped during 2010–2014 for NAICS code 327, manufacturing of nonmetallic mineral products. Data are from the U.S. Census Bureau’s most recent Annual Survey of Manufactures in Reference 13. Credit: ACerS
Manufacturing in selected end-use industries
Typically ceramic and glass materials are used in complex systems, such as automobiles or buildings, or are used to manufacture other goods. Refractories are an example of the latter. Thus, trends in end-use industries can have important implications for ceramic and glass industry sectors. What follows are indicators for few key industries—not a comprehensive list of end-use industries—that utilize a large proportion of ceramic and glass materials.
Manufacturing of computer and electronic products (NAICS code 334) experienced an annual increase of 2.6% in output from 2004 to 2014 and is expected to continue to grow at that rate from 2014 to 2024.
Manufacturing of electrical equipment, appliances, and components (NAICS code 335) experienced a decline of 0.7% in output from 2004 to 2014 and is expected to grow at a rate of 2.1% from 2014 to 2024.
Manufacturing of transportation equipment (NAICS code 336) experienced an increase of 1.9% in output from 2004 to 2014 and is expected to grow at a rate of 1.3% from 2014 to 2024.
Manufacturing of miscellaneous products (NAICS code 339) experienced an annual growth of 3.3% in output from 2004 to 2014 and is expected to continue to grow at that rate from 2014 to 2024. Manufacturing of medical equipment and supplies, which includes orthopedic devices and dental prosthetics, falls within this catch-all category and is expected to grow at an annual rate of 3.3% from 2014 to 2014, slowing from a growth rate of 5.6% from 2004 to 2014.
Data on total shipments for each of these categories during the past five years can be found in Figure 5.
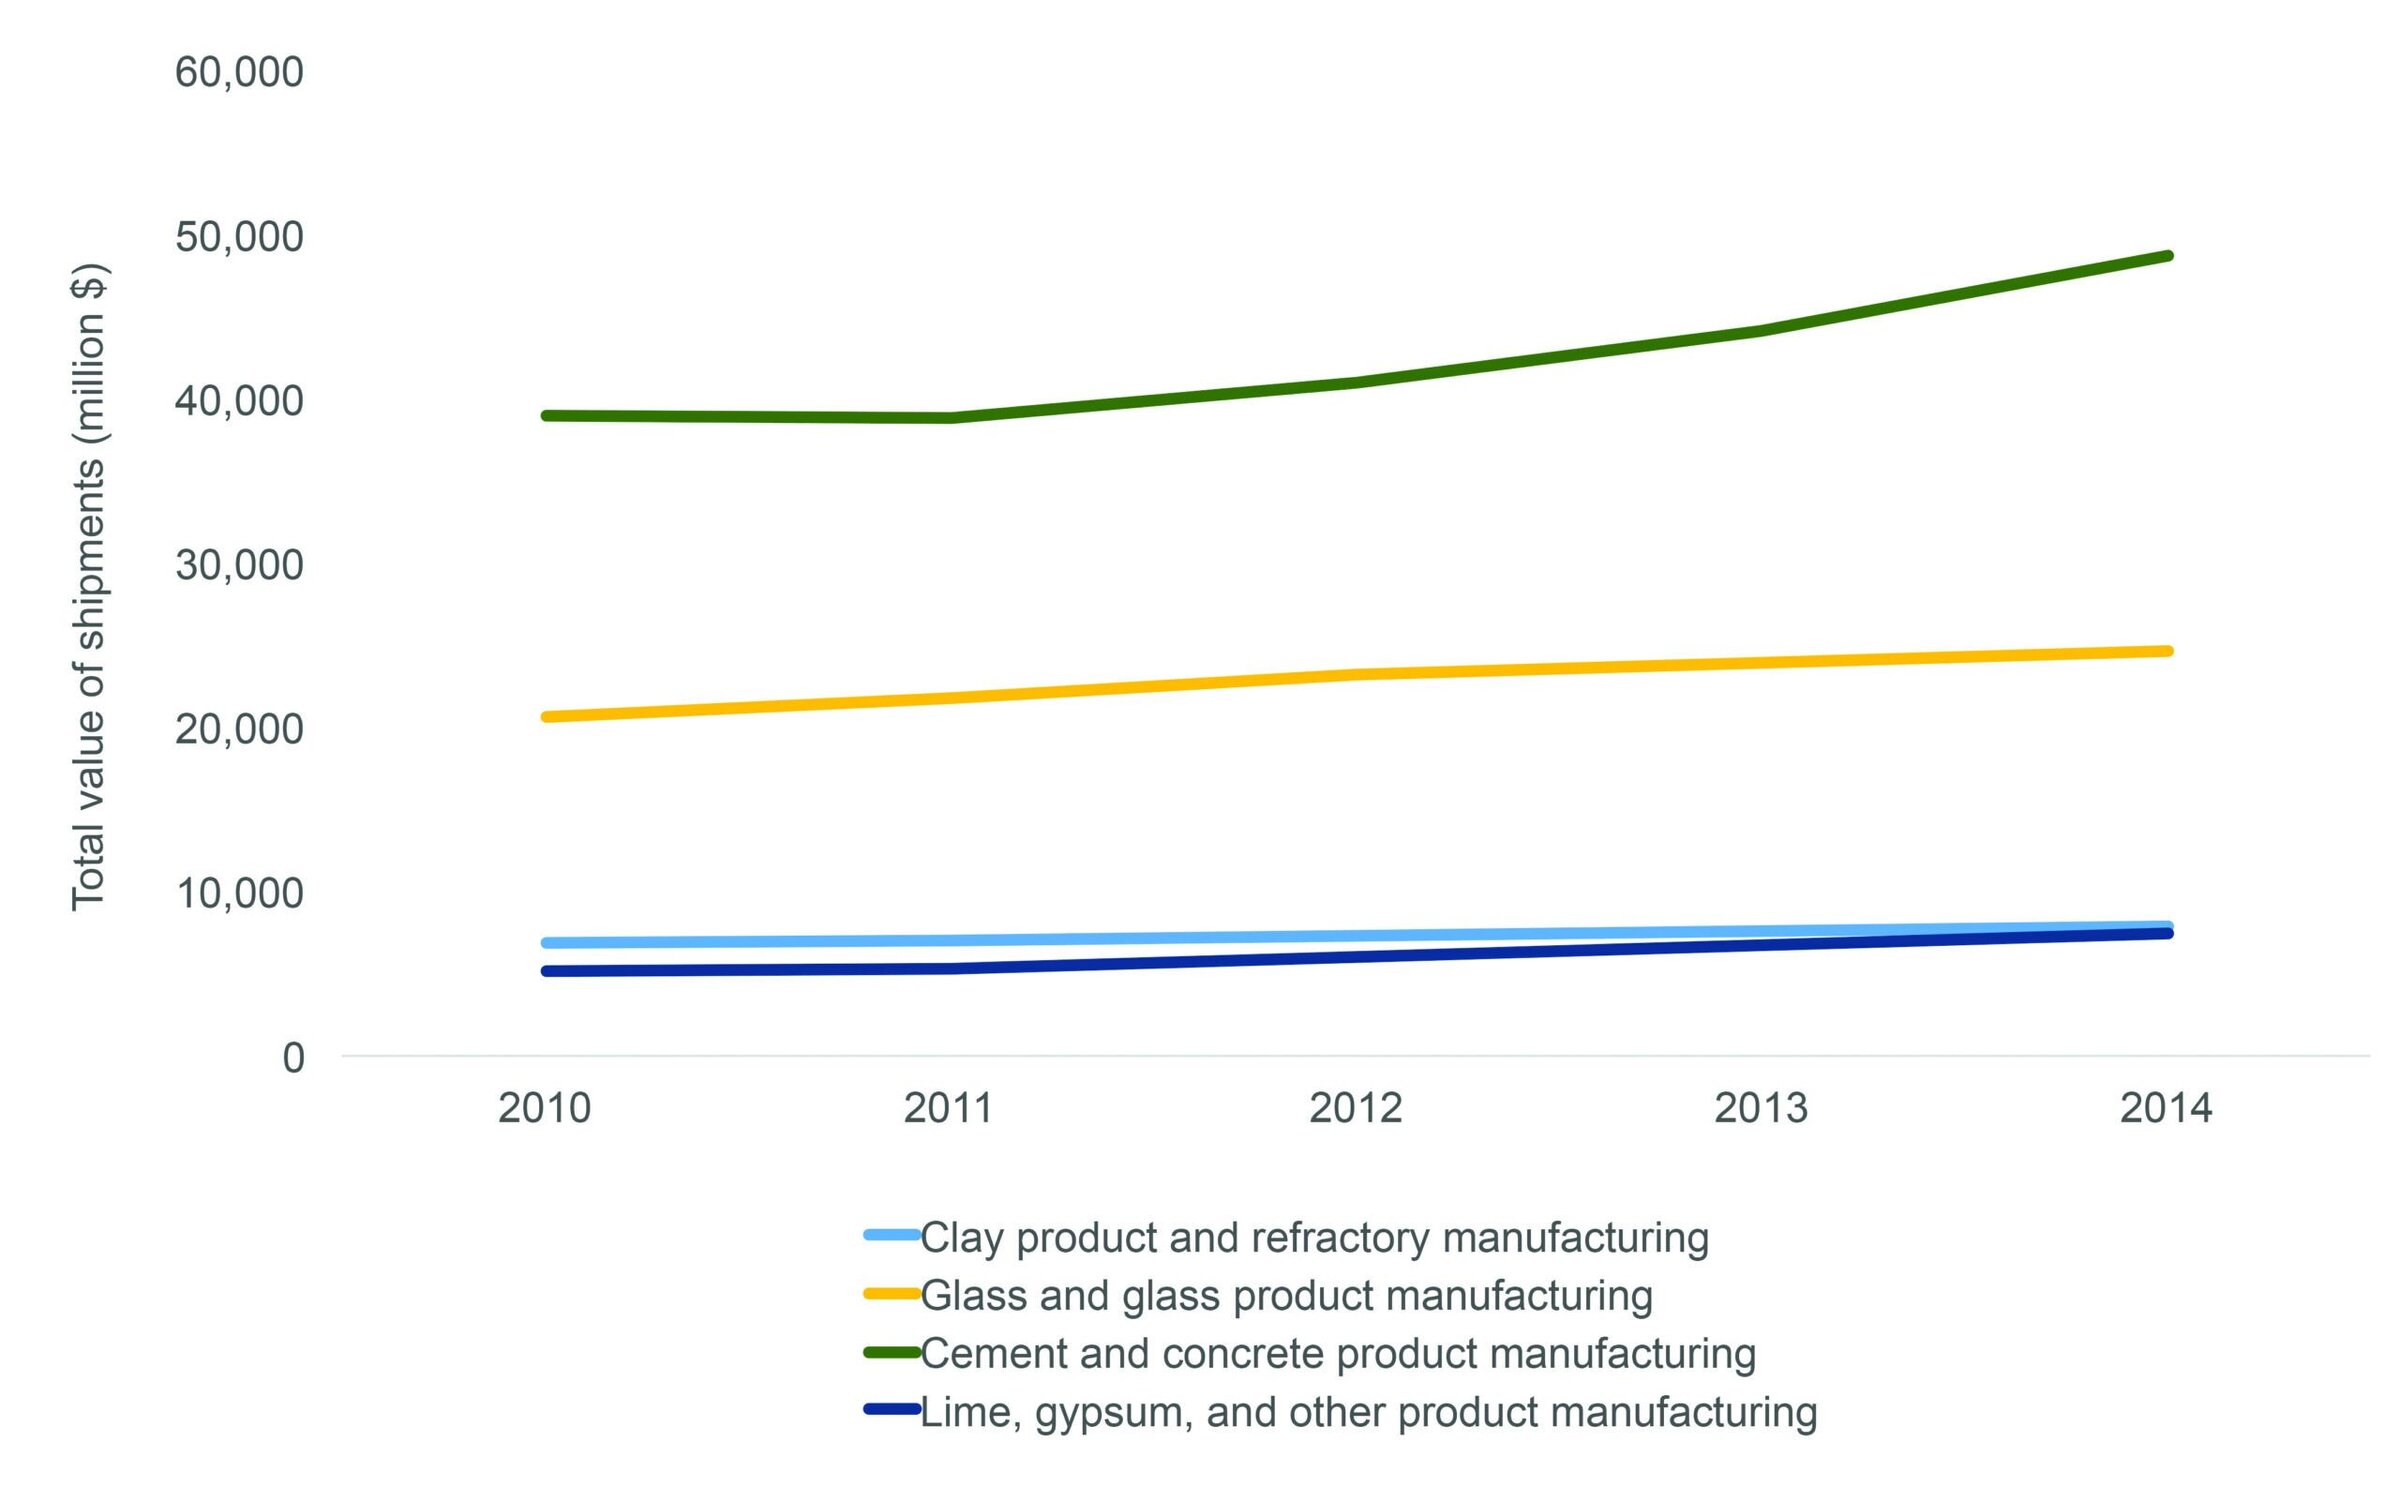
Figure 5. Total value of products shipped during 2010–2014 for selected end-use industries. Data are from the U.S. Census Bureau’s most recent Annual Survey of Manufactures in Reference 13. Credit: ACerS
Sales data provide a sense of scale for the industry
Although general manufacturing and industry trends provide a broader context, such high-level metrics also can gloss over more nuanced trends within a particular sector, and many metrics and indexes exist to measure industry and business health.
Here we focus on sales data for select companies to provide a sense of the scale of industry contributing to the sectors’ overall commerce. Care should be taken to not over-interpret these data. For example, sales data at most companies reflect revenues from sales of more than ceramic and glass products. Also, sales data exclude the cost of doing business and similar considerations. Data sources and its timeliness are noted in the tables. Most data are from Mergent Intellect, formerly known as Dun & Bradstreet’s Million Dollar Database and company websites.
Table 2 presents sales data and market drivers for select ceramic and glass manufacturing companies. Large companies, such as GE and 3M, are as much end users as suppliers, and their highly diversified product portfolios generate massive revenues. However, the table also shows the broad range of contributors to the industry’s commerce. Even small companies like Du-Co Ceramics and Superior Technical Ceramics are multi-million dollar enterprises.

Data are from Mergent Intellect, formerly Dun & Bradstreet Million Dollar Database (accessed 9/27/2016), and websites [http://qz.com/355116/ges-5-billion-annual-rd-budget-is-transforming-advanced-manufacturing-and-the-industrial-internet (accessed 10/5/2016); www.saint-gobain.com/en/group/about-saint-gobain (accessed 10/5/2016; currency converted as 1.10E=$1); http://solutions.3m.com/wps/portal/3M/en_US/3M-Company/Information/Profile/Performance (accessed 10/16/16); http://www.morganadvancedmaterials.com/en-gb/about-us/strategy (accessed 11/1/16); http://www.du-co.com(accessed 11/1/16); http://www.ceramics.net (accessed 11/1/16); http://www.mcdanelceramics.com/about (accessed 11/1/16); http://investor.ppg.com/~/media/Files/P/PPG-IR/financial-information/annual-reports/2015-annual-report.pdf
This market profile is representative, but not comprehensive. Inevitably, some companies are not included that could have been. Thus, we invite readers to suggest companies or sectors to profile in the future (see author contact information on this page).
Electroceramics
The electroceramics segment of the advanced technical ceramic industry manufactures ceramic piezoelectrics, capacitors, insulators, resistors, and conductors. Integration of electronics into systems such as automobiles, energy technologies, medical devices, buildings, appliances, industrial equipment, and the Internet of Things drive demand for better, faster, cheaper, lighter electronics, and in turn, drive the electronic components industry. Arguably, batteries and energy conversion devices, such as fuel cells, could be included in this category, but those sectors are excluded for this profile even though some companies also produce energy conversion and storage technologies.
The number of components manufactured is staggering—one report estimates Chinese manufacturers made 1.98 trillion multilayer ceramic capacitors (MLCCs), which fell short of meeting an estimated demand for more than 2 trillion MLCCs in 2015 in China alone.14 Market research analysts value the ceramic capacitor global market at $7–$10 billion in 201515 and the piezoelectric market at more than $20 billion in 2015.16 Note that the piezoelectric market includes piezoceramics as well as polymer- and composite-based devices. The market for spark plugs, an insulation application, is expected to climb to $2.8 billion in value by 2019 at a CAGR of 5.26%.17
Table 3 summarizes sales and key business drivers for select companies in the sector. Sales data show the top three companies—all Japan-based—generate revenues of $5–$10 billion yearly. Samsung Electro-Mechanics is gaining on its next competitor, TDK, and is reported to have passed it in MLCC sales since 2009.14
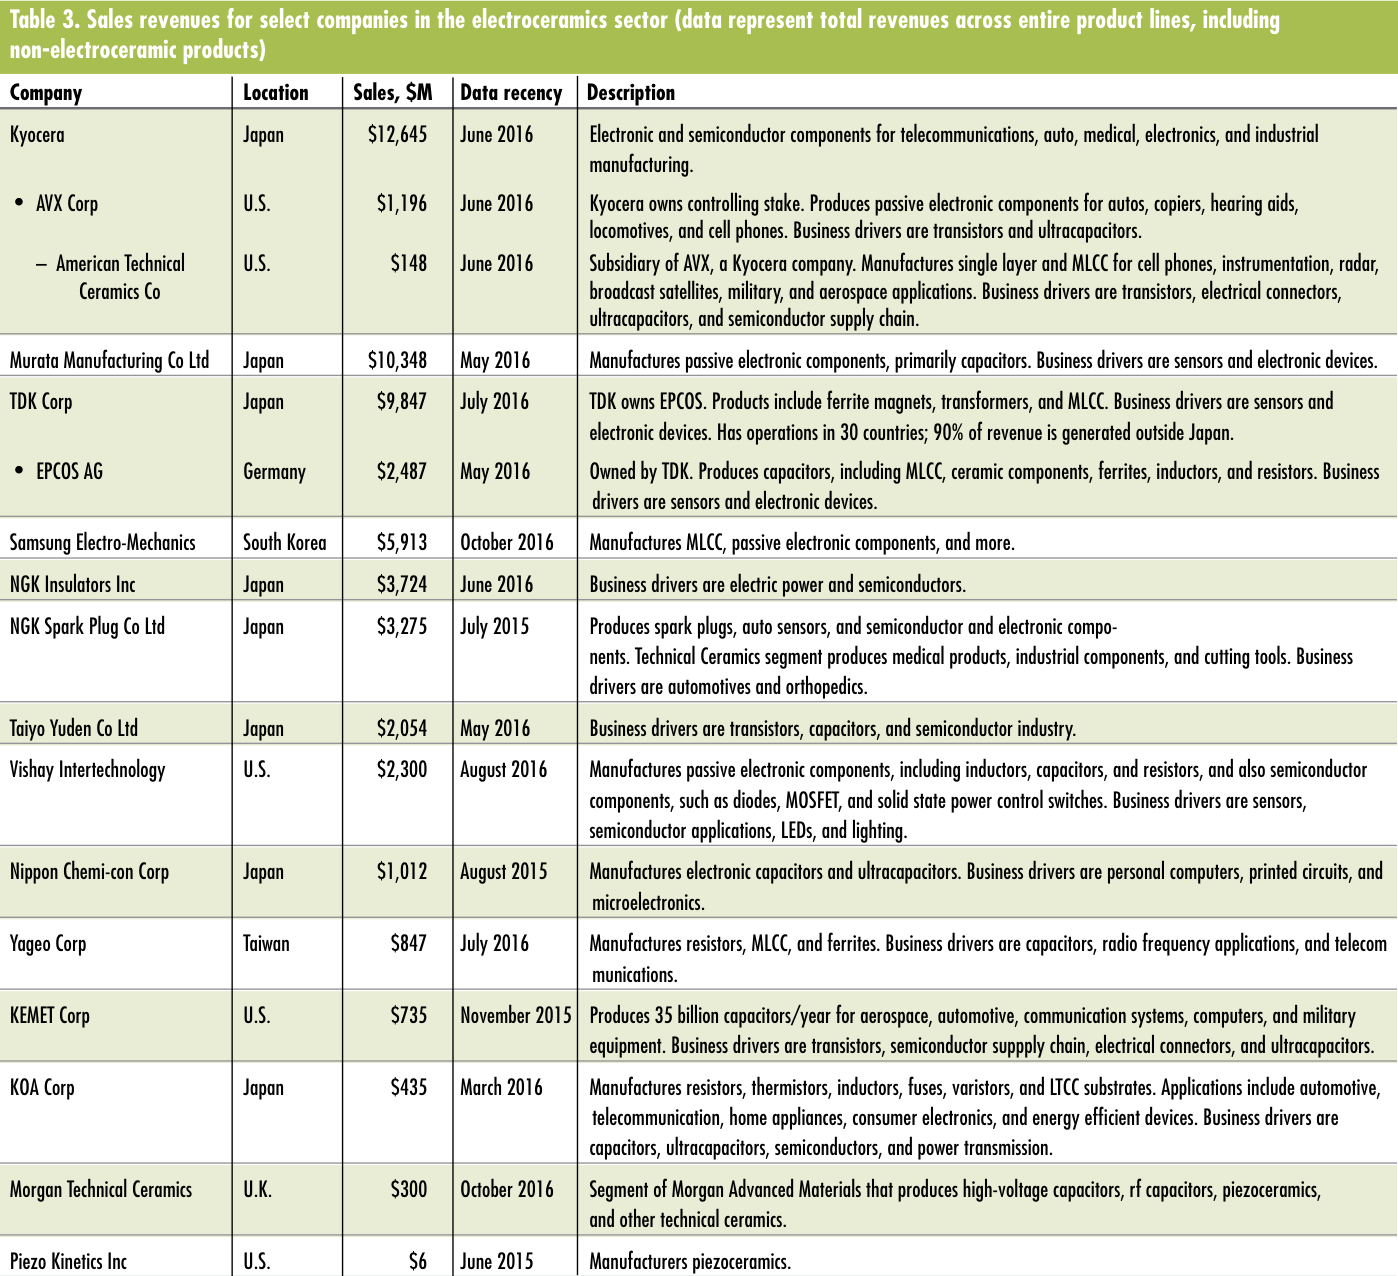
Data are from Mergent Intellect, formerly Dun & Bradstreet Million Dollar Database (accessed 9/27/2016), and company websites [www.murata.com/en-us/about/ir/financial/products (accessed 10/6/2016); www.samsungsem. com/global/news/index.jsp?artId=1396649 (accessed 10/4/16); www.koaglobal.com/ir/highlight (accessed 10/30/16; currency converted 10/30/16); www.morganadvancedmaterials.com/en-gb/investors/financial-highlights/divisional-performance (accessed 10/4/16; currency converted 10/6/2016)].
Murata Manufacturing Company (Kyoto, Japan) provides an example of the magnitude of the business in this sector. Murata dominates the MLCC market with a 22.8% share in 2015 according to a Research and Markets report.14 Sales data (Figure 6) from the company’s 2015 annual report show how products within its portfolio have generated increasing revenues during a five-year span.18
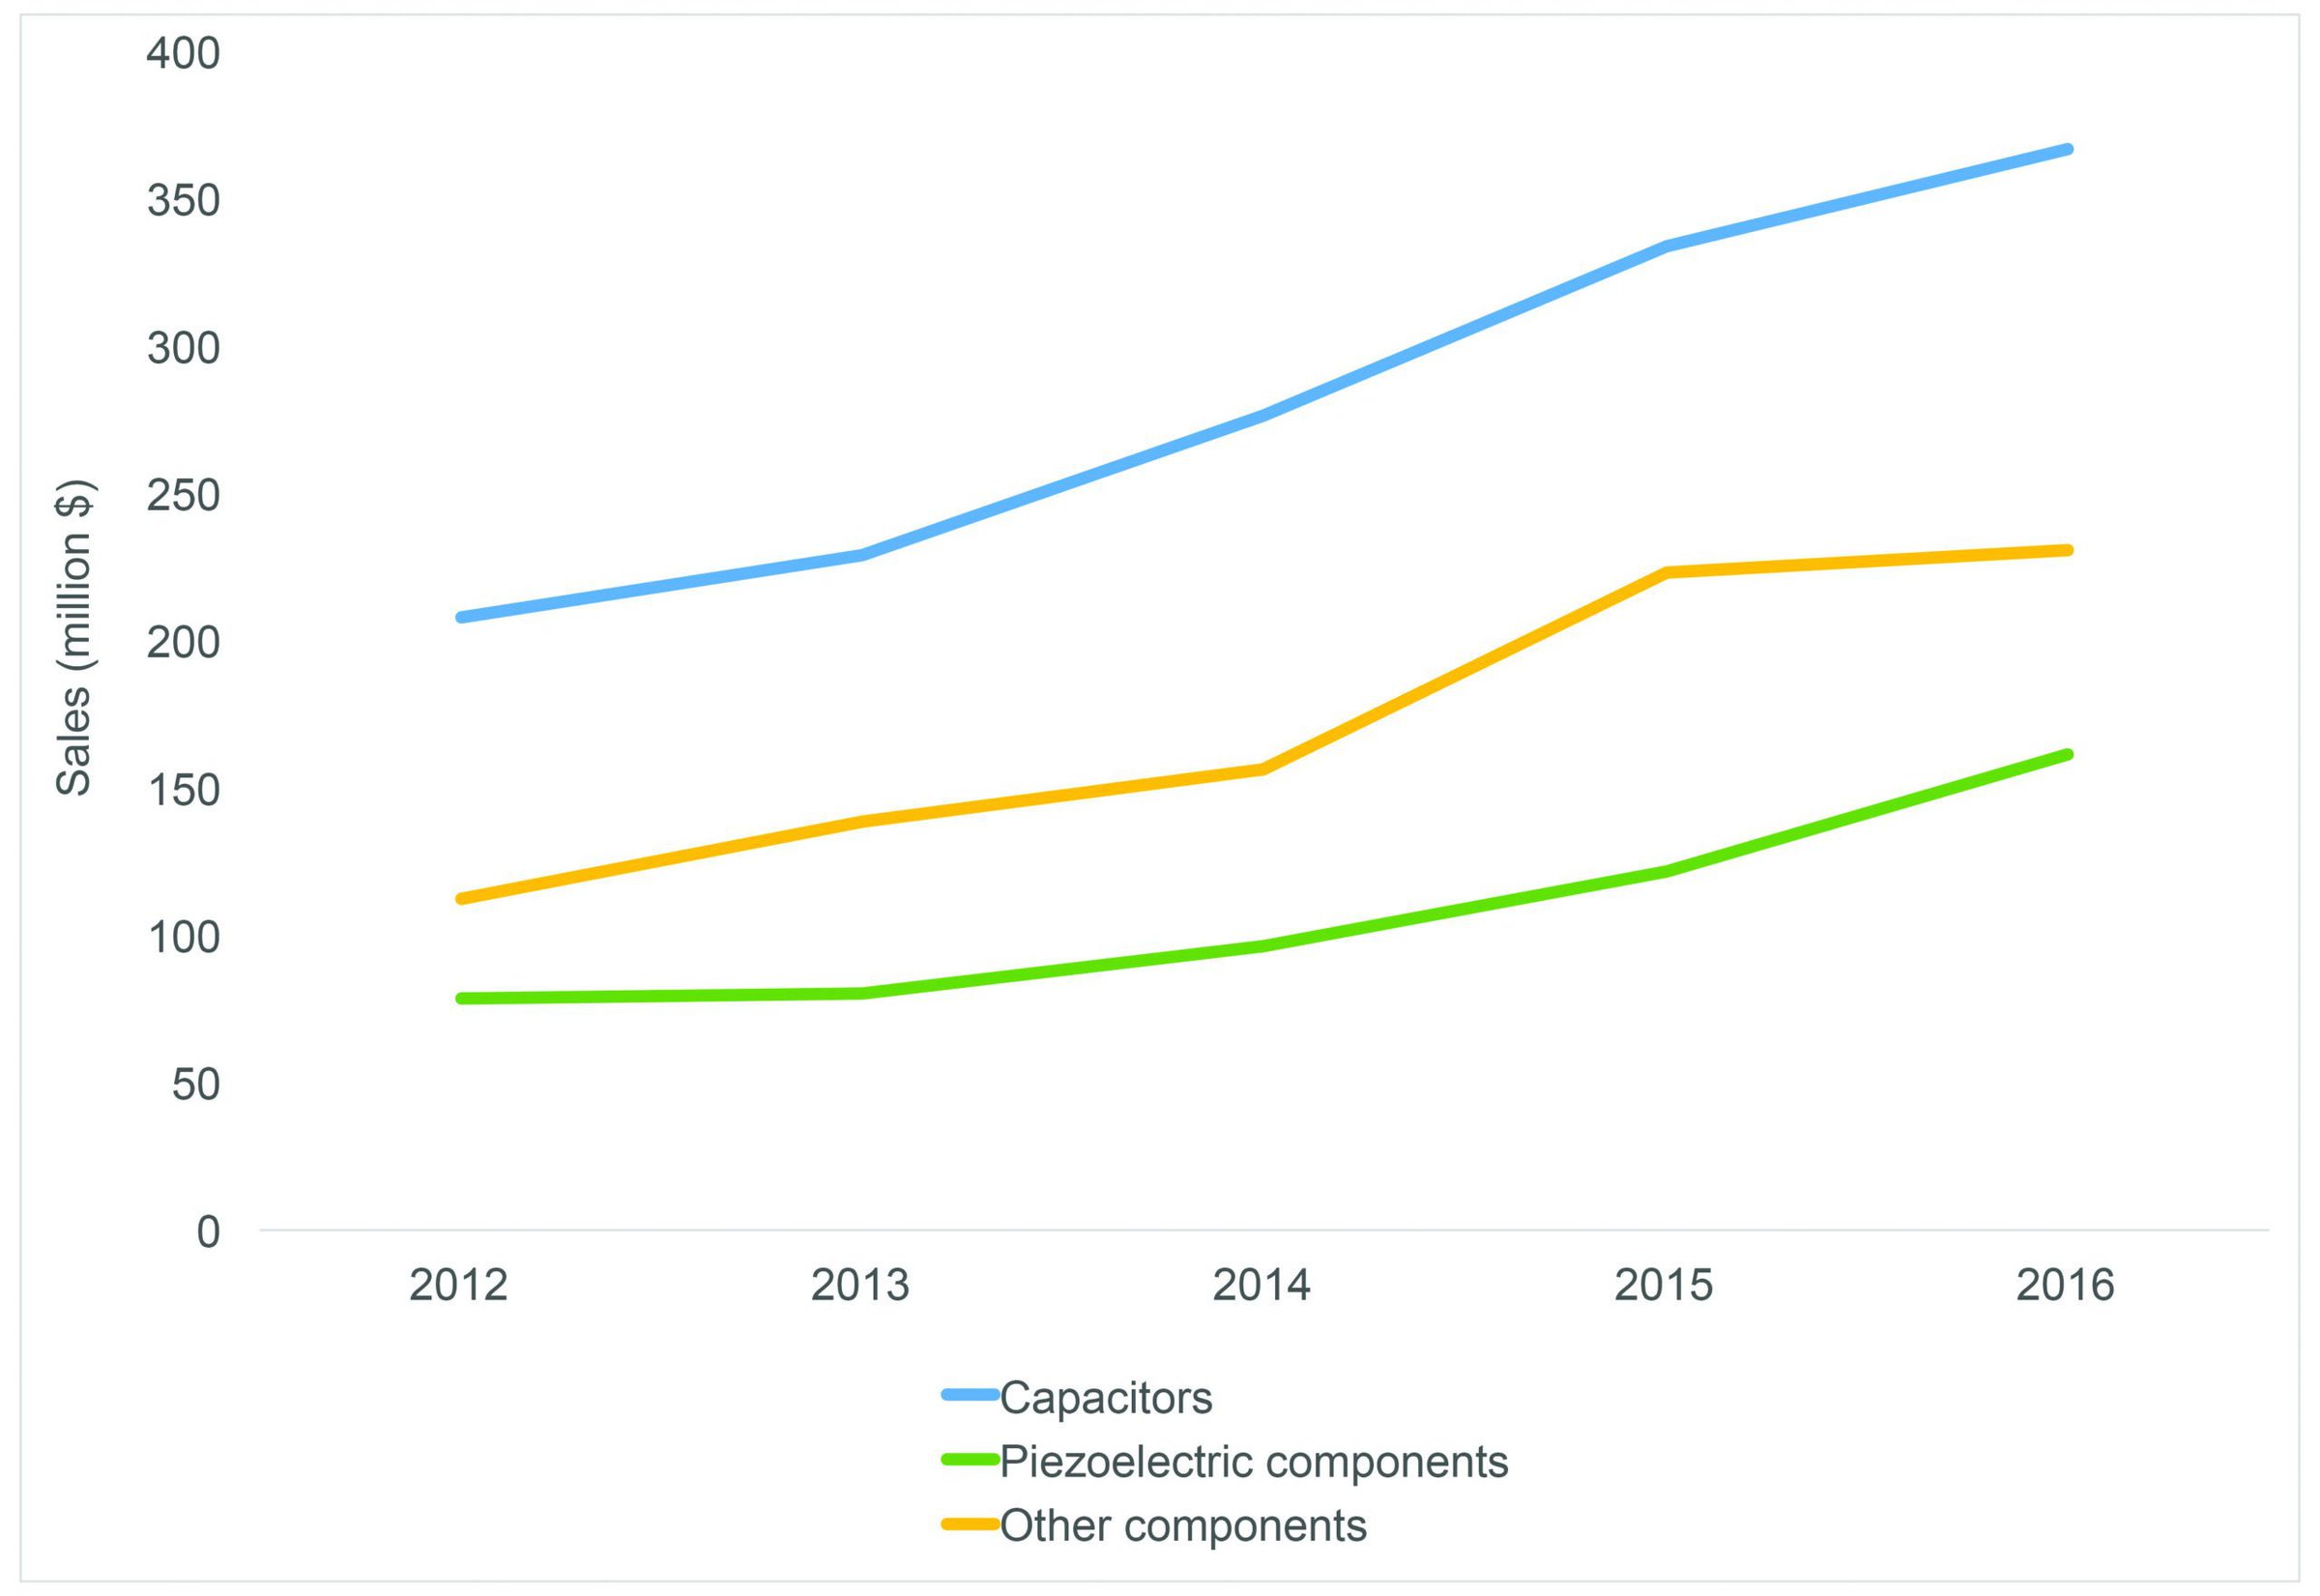
Figure 6. Rising trends for Murata five-year sales of electronic parts and components. Data are for FY ending March 31 and are based on an exchange rate of ¥1= $0.0096 on 10/6/2016. Data from www.murata.com/en-us/about/ir/financial/products (accessed 10/6/2016). Credit: ACerS
Other companies listed in Table 3 report significant revenues—sales in the billions will always be impressive—but clearly they face challenging competition from the industry’s giants. Business drivers for these “smaller” companies include semiconductor and electronic devices, electric power, automotives, sensors, telecommunications, and defense.
Refractories
It has been said that if you are in the refractories business, you are in the steel business. The iron and steel industry consumes about 60% of global refractory production, with the rest serving the glass, cement, nonferrous, energy, and petrochemicals industries (Figure 7).19
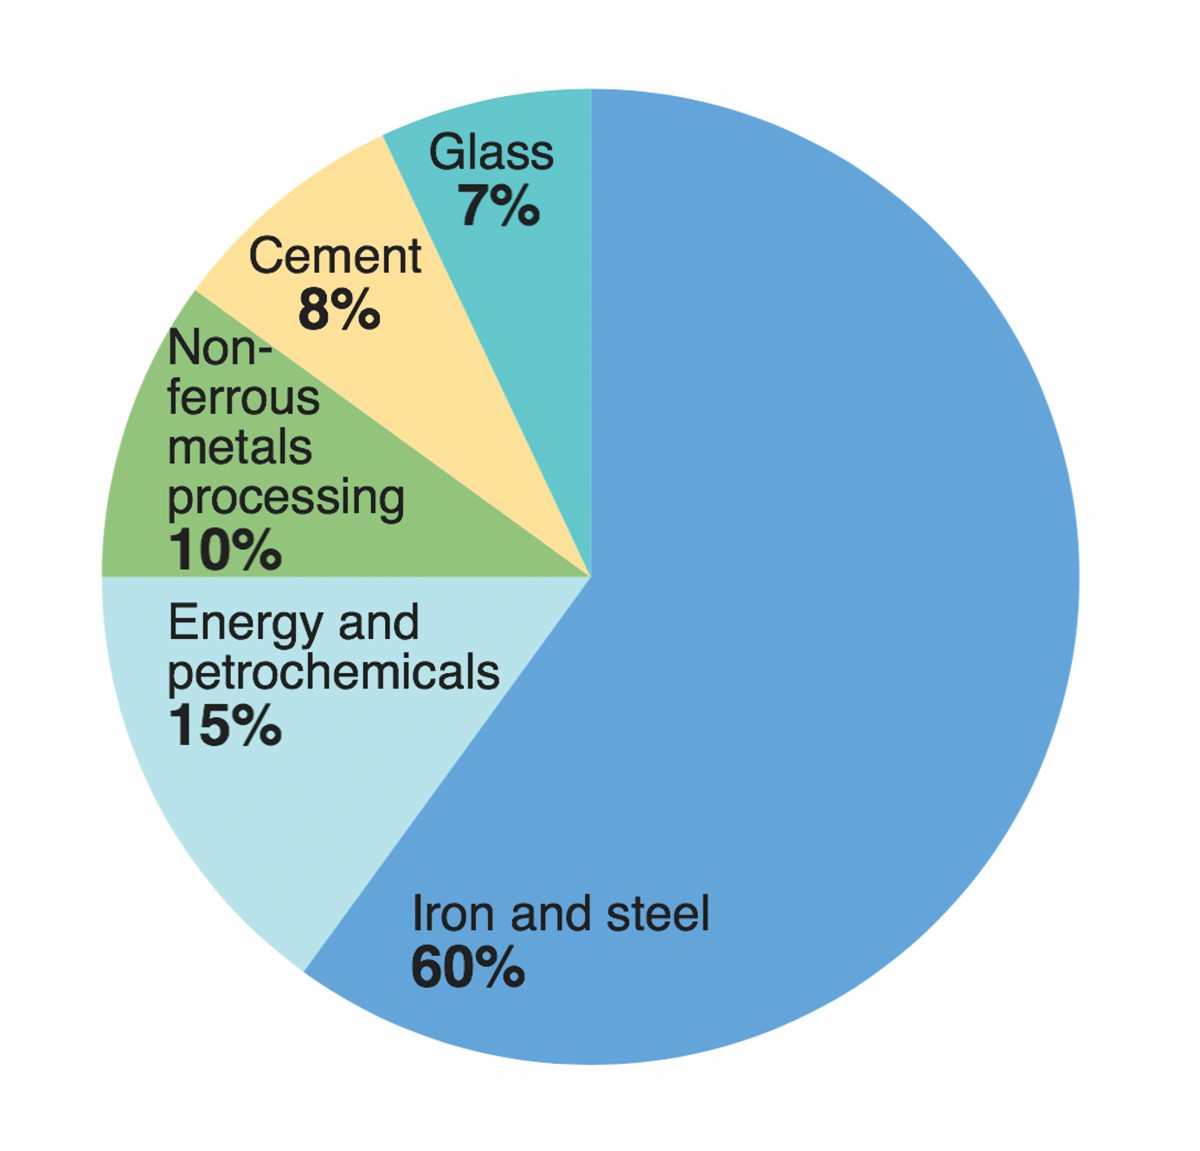
Figure 7. Major industries that consume global refractory production. Data from Reference 19. Credit: ACerS
The combined refractories and clay building materials industry generates revenues and has a consolidated supplier base that suggest a delayed response to the Great Recession. Figure 8 compares 10-year trends for revenues and the number of companies operating under NAICS code 327120, “clay building material and refractories manufacturing.”
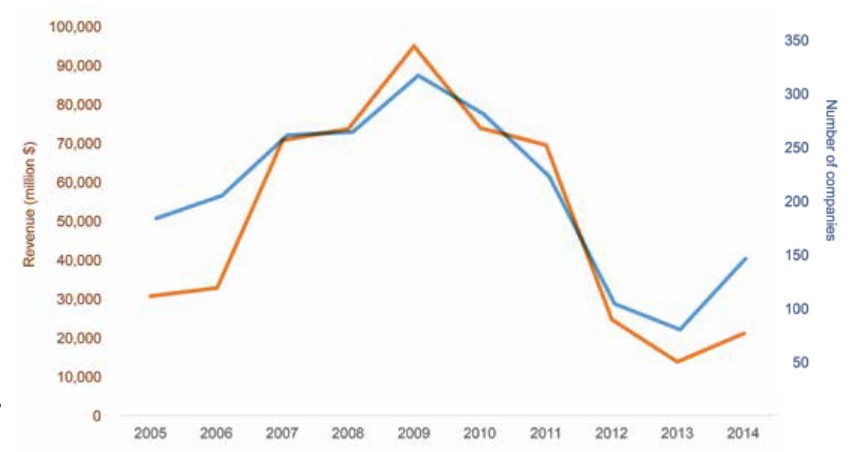
Figure 8. Ten-year sales trend (red line) for companies active in clay building material and refractories manufacturing, which includes nonrefractory manufacturers, such as brick and clay-tile manufacturers. Sales revenue reflects the trend for number of companies active in the sector (blue line). These data include products such as architectural brick, clay roof tile, and clay pipe, and exclude nonclay refractories. Data from Reference 18. Credit: ACerS
At the industry’s peak in 2009, 317 companies operated in this sphere and generated almost $95 billion in sales, according to Gale Business Insights database.20 By 2013, the number of active companies dropped to 80 worldwide, with annual global revenues of almost $14 billion.
Data from 2014 appear to point to the beginning of a recovery for the industry, although further consolidation looks imminent with the merger between RHI and Magnesita to form RHI Magnesita.21 The deal—announced October 5, 2016—will be effective in 2017 if approved by government regulating agencies. The new company would be based in The Netherlands.
The global impact of the Great Recession, however, is only part of the story. Advances in refractories engineering have led to increased efficiency and longer furnace campaigns for steelmaking. To illustrate, in a 2014 ACerS Bulletin article, Charles Semler reported refractory consumption from 1950 to 2010 dropped from 61 kg/(ton steel) to 15 kg/(ton steel)—some steel plants even achieved extreme efficiencies of 7–8 kg/(ton steel).22 Trends in refractory engineering include an increase in the use of unshaped monolithic refractories over brick and improved castables, along with improved shotcasting and gunning processes. Nonetheless, overall consumption of refractories by the iron and steel industry is increasing (Table 4).
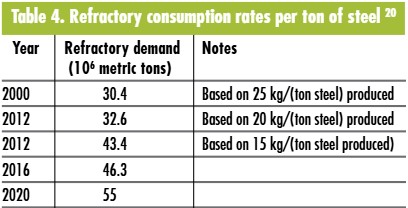
Data from Reference 20. Table created by ACerS.
As the high-volume carbon-steel-producing industry gains efficiency, longer-lasting refractories means slower turnover for refractory producers. In contrast, alloyed steels and other high-quality materials drive development of refractories engineered to specific needs. In a recent paper, Buhr et al.23 note that more than 2,000 grades of steel are on the market—each with properties engineered for specific applications. These steel operations call for refractories engineered for high-performance in critical areas, such as ladle linings, purge plugs, and sliding gates.
New technologies in refractory engineering also push industry innovation. The dusty refractories plants of old are giving way to modern plants with the ability to engineer customized refractory solutions and robotic production lines. Future refractories will be highly engineered, high-performance materials systems, some with functionality not imagined previously. Emerging ideas include refractories with shape-engineered aggregate, nanoparticle additions to control pore-space properties, self-healing refractories, and refractories that can “clean” steel at interfaces.
Table 5 lists select refractory producers worldwide. A handful of companies achieve yearly revenues in the billion-dollar neighborhood of $924 million to more than $5 billion. Other companies generate revenues in the hundreds of millions. Interestingly, a fair number of smaller companies produce revenues in the tens of millions. The market also supports smaller companies (not listed) that post revenues less than $10 million per year.

Data are from Mergent Intellect, formerly Dun & Bradstreet Million Dollar Database (accessed 9/27/2016), private communications, and company websites [www.imerys.com/scopi/Group/ImerysCom/imeryscom.nsf/pagesref/ REBA-A9LL9Z/$file/RA_Imerys_2015_VA.pdf (accessed 10/31/16; currency conversion calculated 10/31/16); www.morganadvancedmaterials.com/en-gb/investors/financial-highlights/divisional-performance (accessed 10/4/16)].
R&D top priority in FY 2017: Renewable energy and emerging technologies
Beyond output, employment, and sales data, another important measure of the health and trajectory of an industry is the amount of money diverted to R&D. The National Science Foundation (NSF) tracks business R&D expenditure data with its Business Research and Development and Innovation Survey (BRDIS). BRDIS provides data on domestic and global R&D expenditures at for-profit businesses based on a survey conducted annually by the U.S. Census Bureau in accordance with NSF’s National Center for Science and Engineering Statistics. The latest report, issued this year, details statistics from 2013.
Dollars spent on R&D at businesses worldwide in 2013 greatly varied by sector, with semiconductor and other electronic component manufacturing spending more than $40 billion (Figure 9).24 Aerospace product and parts manufacturing and motor vehicle manufacturing also spent tens of billions of dollars on R&D, reflecting their vast sizes and market values. Perhaps surprisingly, R&D for medical equipment and supplies manufacturing is slightly more than $10 billion, although this category accounts only for equipment, supplies, and implants for medical, dental, surgical, and ophthalmic areas. Many NAICS industry codes cross-reference with other coding areas, indicating that the coding divisions imperfectly divide markets.
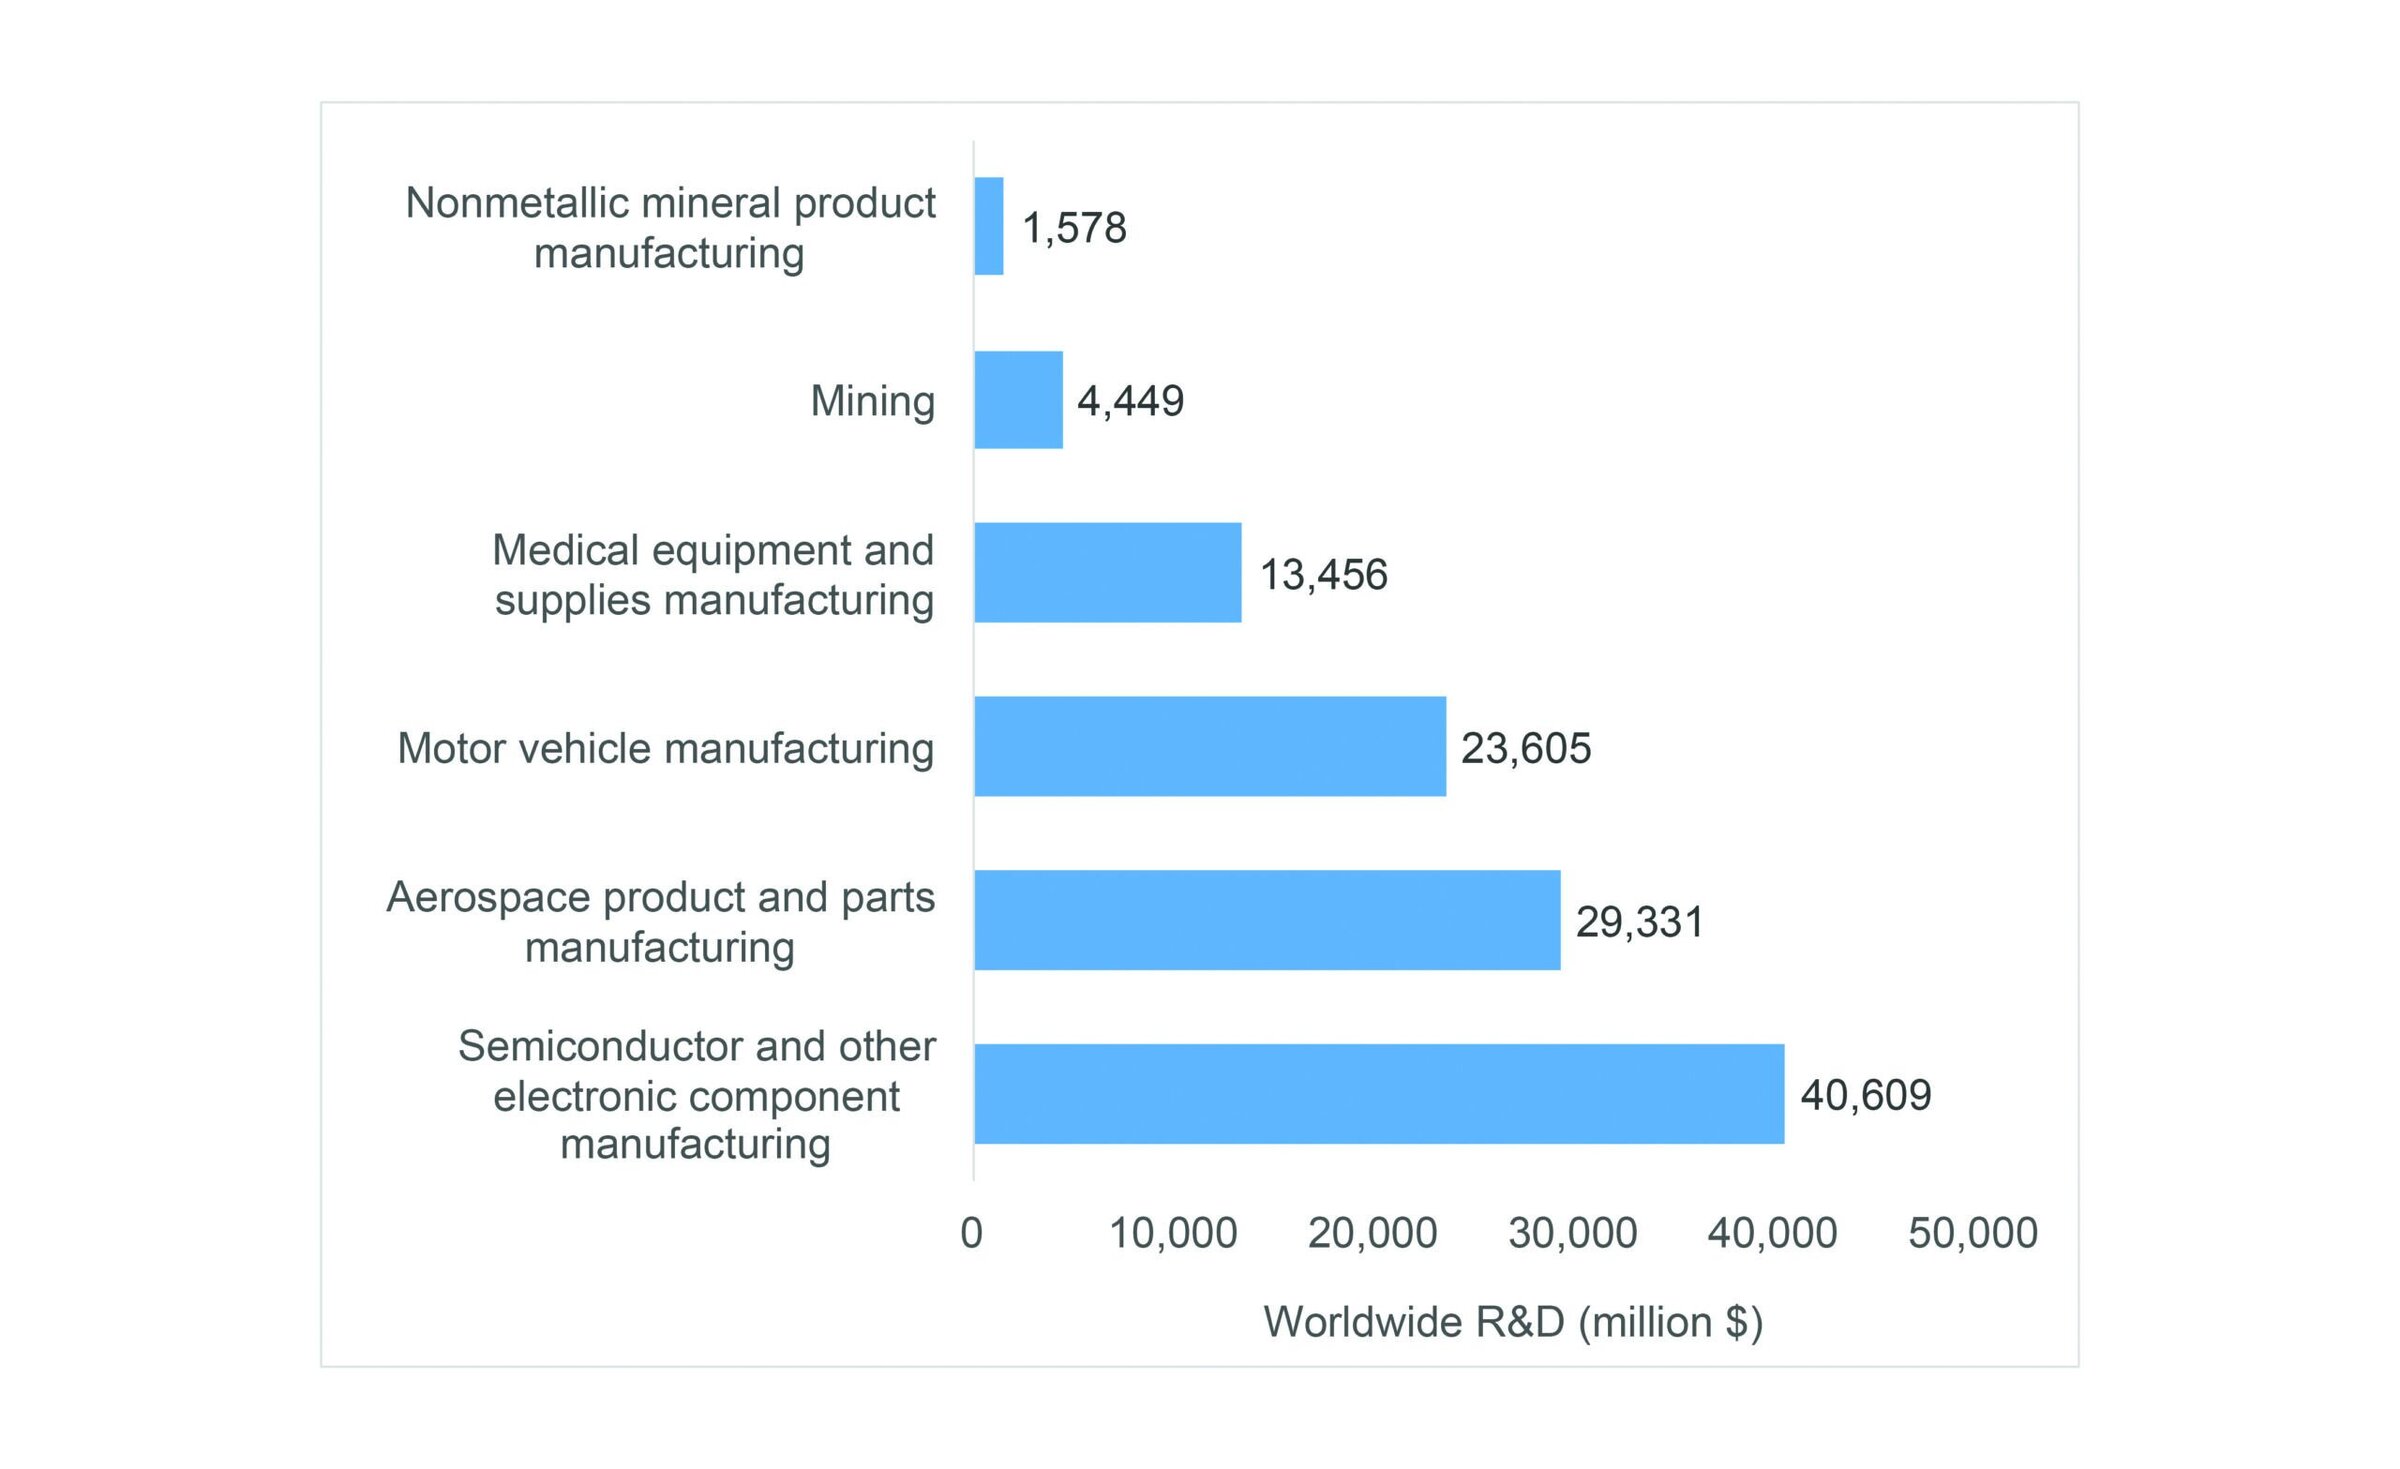
Figure 9. Dollars spent on R&D at worldwide businesses in 2013. Data are from the 2013 Business Research and Development and Innovation Survey in Reference 24. Credit: ACerS
In addition to R&D dollars spent within industry, government allocation of federal R&D spending is another metric to examine the health of particular sectors. On September 30, 2016, the United States Congress passed a continuing resolution through December 9 to delay definitive FY 2017 spending decisions until after the November presidential election.25
The Obama Administration released its R&D budget proposal for FY 2017 in February, highlighting the need to prioritize funds to further clean energy and climate initiatives. However, increased spending did not span all science-related programs. Agencies including NSF received limited discretionary increases, and the plan recommends that billions of dollars be slashed from National Institutes of Health (NIH) and National Aeronautics and Space Administration (NASA) budgets.
Staring down the barrel of the current appropriations cycle, President Obama and Congress did not have much fiscal latitude. In its recent budget analysis, American Association for the Advancement of Science (AAAS)26 reports in a recent FY 2017 appropriation summary that “discretionary spending—the part of the budget adjusted annually by appropriators, and the source of most federal science funding—was slated to be held flat at $1.07 trillion, under the second and final year of the Bipartisan Budget Act.”
Science and technology agencies currently face an uncertain budgetary future while Congress hashes out federal spending details from now through the end of the year. Although the financial outlook appears hazy, AAAS reports that with a “complete set of twelve appropriations bills already through committee, and appropriators’ decisions so far will factor into omnibus negotiations later.”
But, according to the latest AAAS estimates, the House and Senate would provide moderate increases to federal R&D overall in FY 2017—the House would provide a $3.1 billion or 2.1% increase for R&D above FY 2016 levels, while the Senate would provide a $4.7 billion or 3.2% increase. Both amounts would represent real-dollar increases given at a 1.8% rate of inflation—which would actually outpace spending levels outlined in Obama’s budget proposal.
Table 6 presents a high-level two-year snapshot of funding for some of the largest science agencies from FY 2015 to FY 2017, including the numbers proposed in Obama’s FY 2017 R&D budget, according to AAAS.27
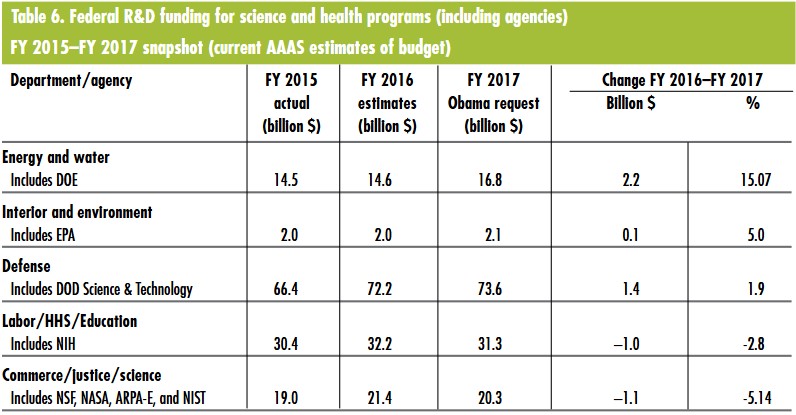
Data from Reference 27. Table created by ACerS.
Clean energy and environmental research get top billing. This includes the Department of Energy’s programs. Obama’s budget plan requests $16.8 billion for clean energy research and renewable energy programs—the highest increase in federal R&D spending—up 15.07% from FY 2016. Interior and environment R&D spending, which includes the Environmental Protection Agency’s programs and initiatives, comes in second with a request for $2.1 billion—up 5.0% from FY 2016.
More money for national defense also is a priority. This includes the Department of Defense (DOD) science and technology initiatives. The Obama administration requests $73.6 billion for DOD science and technology R&D in FY 2017—up 1.9% from FY 2016.
Labor, health, and human services, and education could take a hit. This includes NIH programs. Obama’s budget plan requests $31.3 billion for labor, health, and education initiatives—down 2.8% from FY 2016.
Broad cutbacks could be imminent for commerce, justice, and science. This includes programs within the NSF, NASA, Advanced Research Projects Agency-Energy (ARPA-E), and National Institute of Standards and Technology. Obama’s budget plan requests $20.3 billion for R&D in these areas—down 5.14% from FY 2016.
According to a fact sheet published in February by the White House,28 Obama’s budget proposal specifically includes $512 million for NSF research in conversion, storage, and distribution of diverse power sources and the science and engineering of energy materials. In July, NSF announced it will invest more than $400 million over the next seven years to support fundamental wireless research to develop platforms for advanced wireless research in support of the White House’s Advanced Wireless Research Initiative.29
Obama’s budget proposal also requests $350 million in Mission Innovation discretionary funding for DOE’s ARPA-E, which supports transformational applied clean energy R&D across a wide array of technologies; and $348 million for clean energy research at NASA in revolutionary aircraft technologies and configurations to facilitate development of fuel-efficient, low-carbon-emitting aircraft.
Of course, these numbers are not set in stone. Congress will likely increase R&D spending in fiscal 2017 before year’s end, according to AAAS. And Congress is on track to increase federal spending for R&D by at least $3.1 billion in FY 2017 over the previous year, despite the fact that overall federal discretionary spending is slated to remain relatively flat, according to the latest AAAS analysis of federal spending programs.
The global picture
Beyond the United States, how does the worldwide economy look?
The International Monetary Fund (IMF) usually publishes its World Economic Outlook twice a year, representing a survey of staff economists’ analyses of global economic developments. The outlook report published in October 2016 indicates subpar global growth of 3.1% in 2016, with a slight increase of 3.4% predicted for 2017.1 “Taken as a whole, the world economy has moved sideways,” IMF chief economist and economic counsellor Maurice Obstfeld says in the report. “We have slightly marked down 2016 growth prospects for advanced economies whereas marking up those in the rest of the world.”
Stagnation in the U.S. market, uncertainty following the United Kingdom’s exit from the European Union, and slow growth in Japan’s leading economy are all contributing to this subpar market growth. But, despite the lackluster performance of those advanced markets, emerging markets are expected to pick up some of the worldwide slack with an overall 4.6% growth rate. China’s economy is expected to expand 6.6% in 2016 and 6.2% in 2017, showing signs of slowing as the country shifts away from investment and industry and, instead, moves toward more sustainable reliance on consumption and services, according to the IMF. In addition, India is expected to continue to grow at one of the fastest paces for major world economies, with more mixed economic predictions in Africa and Latin America.
NAICS codes—what do they mean?
The North American Industry Classification System (NAICS) divides business establishments by industry to collect, analyze, and publish statistical data related to the U.S. economy. NAICS was adopted in 1997 to replace the Standard Industrial Classification (SIC) system. Pertinent codes for the ceramic and glass industries, including selected relevant end-use industries, are described below.
327—Nonmetallic mineral product manufacturing
Includes establishments that manufacture brick, refractory, ceramic, glass, cement, concrete, lime, gypsum, and other nonmetallic minerals and their respective products. This general classification is further broken down into more specific subsectors.
- 3271—Clay product and refractory manufacturing
Includes establishments engaged in forming or processing pottery, ceramics, clay or ceramic plumbing fixtures, clay or ceramic electrical fixtures, clay and nonclay refractories, ceramic tile, structural clay tile, brick, and other structural clay building materials. - 3272—Glass and glass product manufacturing
Includes establishments that manufacture glass and glass products, including flat glass, pressed and blown glass and glassware, and glass containers. - 3273—Cement and concrete product manufacturing
Includes establishments that manufacture cement; ready-mix concrete; concrete pipe, brick, and block; and other concrete products. - 3274—Lime and gypsum product manufacturing
Includes establishments that manufacture lime from limestone, dolomitic limestone, or other calcareous materials, such as coral, chalk, and shells; and companies that manufacture gypsum products, such as wallboard, plaster, plasterboard, molding, ornamental moldings, statuary, and architectural plaster work.
334—Computer and electronic product manufacturing
Includes establishments that manufacture computers, computer peripherals, communications equipment, and similar electronic products; and establishments that manufacture components for such products.
335—Electrical equipment, appliance, and component manufacturing
Broadly includes establishments that manufacture products that generate, distribute, and use electrical power. This includes establishments that produce electric lamp bulbs, lighting fixtures, and parts; small and major electrical appliances and parts; electric motors, generators, transformers, and switchgear apparatus; and devices for storing electrical power (e.g., batteries), for transmitting electricity (e.g., insulated wire), and wiring devices.
336—Transportation equipment manufacturing
Broadly includes establishments that manufacture equipment that transports people and goods. This includes establishments that manufacture equipment for road, rail, air, and water transportation, including operations that process metal or plastic parts into components and finished products and operations that assemble components into finished products.
339—Miscellaneous manufacturing
Includes industries that manufacture diverse products that do not readily fit into other NAICS manufacturing subsectors, such as establishments that manufacture medical equipment and supplies, jewelry, sporting goods, toys, and office supplies.

Related Articles

Bulletin Features
Emerging Professionals: Science for Society & Future Focus
Science for Society articles: Rishabh Kundu and Ryan C. Eaton: “One small tweak to the lens of materials research, one giant leap for mankind” Grace Dunham: “Microwave firing: Inspiring young scientists through rapid ceramic demos” Hossein Libre: “Shaping materials science through policy engagement” Future Focus articles: Kartik Nemani: “Hope and…

Bulletin Features
Emerging Professionals: Research Articles
Experiential learning: Developing the next generation of engineers By Ryan Eaton When a measure becomes a target, it ceases to be a good measure. Goodhart’s law, coined in reference to monetary policy, is readily applicable to engineering education. When students begin optimizing their study habits to pass an exam rather…

Bulletin Features
Durable and programmable metasurfaces enabled by phase change materials
Controlling light with high spatial precision enables technologies ranging from imaging and sensing to communications. Traditionally, optical components such as lenses and filters rely on bulk materials and fixed geometries, which limit their ability to adapt dynamically. Metasurfaces offer a fundamentally different approach. These materials consist of planar arrays of…