
A burgeoning trade war with China has led the U.S. government to continue investing in domestic production of certain minerals and materials, as reported in the annual United States Geological Survey Mineral Commodity Summaries.1
The USGS Mineral Commodity Summaries report spotlights events, trends, and issues from the past year in the nonfuel mineral industry. Each August, the ACerS Bulletin shares some of the key facts covered in the report.
In 2024, the total value of nonfuel mineral production in the United States was estimated to be $106 billion, an increase of nearly 1% from $105 billion in 2023. The total value of industrial minerals production was $72.1 billion, which is no change from the revised total of 2023. Of this total, $38 billion came from construction aggregates production, including construction sand, gravel, and crushed stone. Crushed stone accounted for the largest share of total U.S. nonfuel mineral production value in 2024 with 24%.
Continuing the trend from last year, the metals sector saw significant decreases in production due to global oversupply. Metals such as cobalt, lithium, and nickel saw decreases of 40–60% compared to 2023 as many other metal-producing countries reduced prices. On the other hand, the industrial minerals sector again saw increased production values for aggregates due to higher prices.
As a continuation of the U.S. government’s goals to expand the domestic mining sector, several congressional acts, investments, and projects were passed or launched in 2024. For example, the Department of Defense (DOD) awarded more than $400 million through the Defense Production Act Investments program to U.S.-based projects that aim to establish domestic manufacturing capacities for critical minerals production. The DOD also announced awards of more than $40 million to Canadian companies to support the United States–Canada Joint Action Plan on Critical Minerals.
Even with these developments, the U.S. still relies heavily on foreign sources for certain raw and processed mineral materials. In 2024, the U.S. was 100% reliant on 12 out of 50 individually listed critical minerals, as well as more than 50% net import reliant on 28 more critical mineral commodities. The recycling of antimony, bismuth, chromium, germanium, magnesium metal, tin, tungsten, and vanadium served as the only source of domestic supply for these materials.
The five-year period of 2020–2024 showed declined consumption for many mineral commodities. This decline indicates some substitutions may be in use for certain materials or that less products are being produced with raw mineral commodities. The largest decreases of more than 25% were seen with thallium, asbestos, bauxite, bismuth, industrial diamond (stones), and strontium.
Considering these trends, the U.S. Department of Energy announced a $75 million project in April 2024 to construct a Critical Minerals Supply Chain Research Facility funded by the Bipartisan Infrastructure Law.2 Moreover, legislation such as the Critical Minerals Security Act of 20243 and National Critical Minerals Council Act4 were introduced to help keep track of all global critical mineral and rare earth element activities and implement a national critical minerals strategy, respectively.4
Regarding the ongoing trade war with China, in May 2024, President Joe Biden raised tariffs on electric vehicles, solar cells, steel, aluminum, and metal equipment from China.5 That December, China issued export bans on antimony, gallium, and germanium.6 In response, the United States Trade Representative began a Section 301 investigation on China regarding their dominant role in the semiconductor industry.
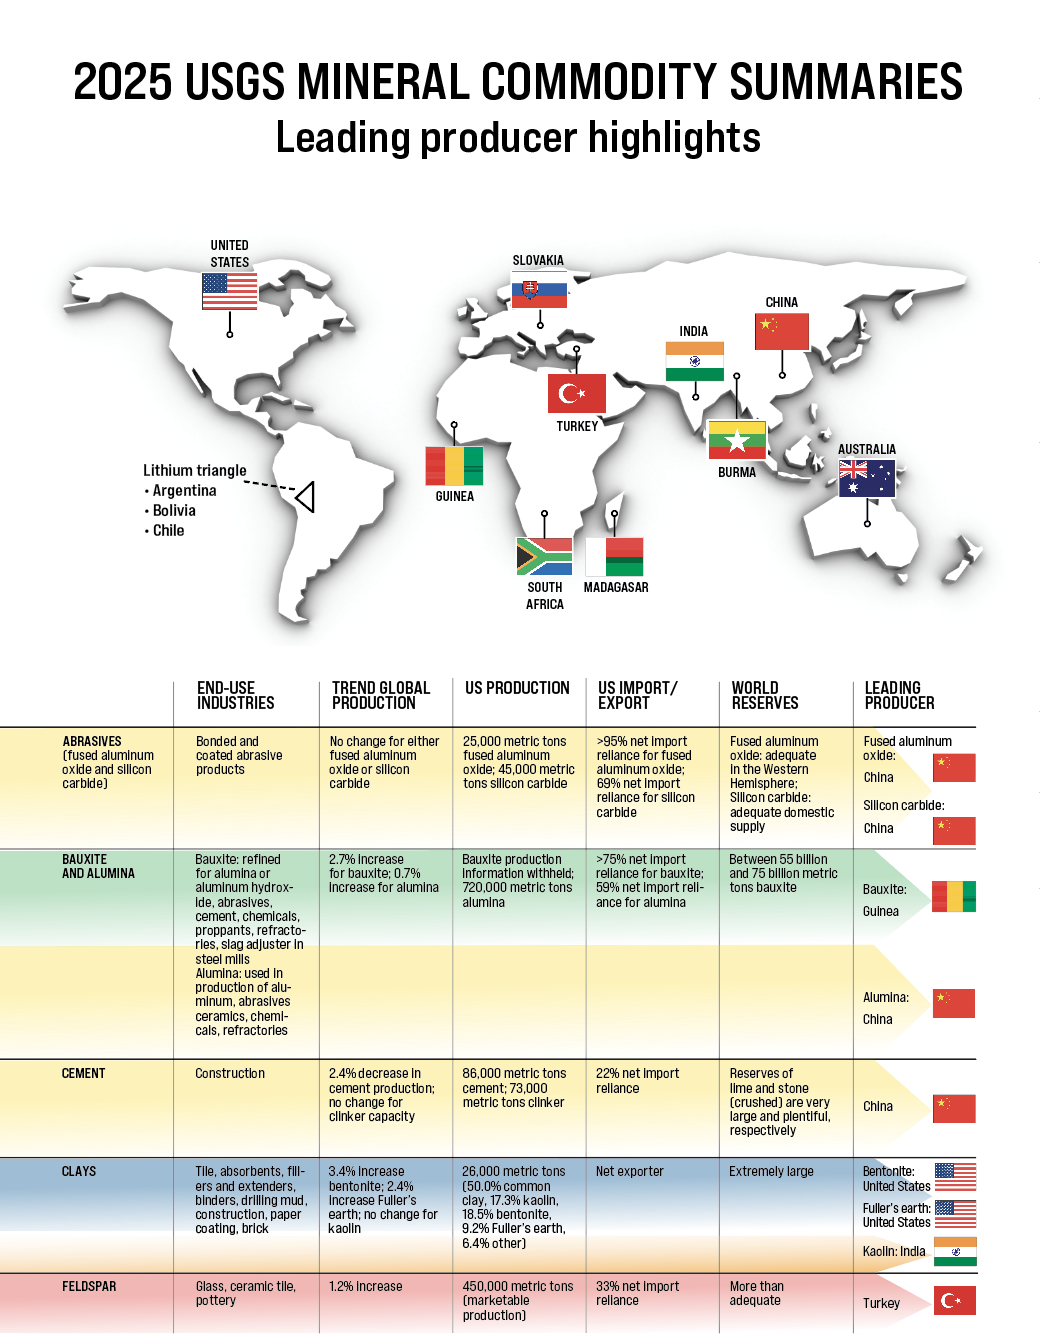
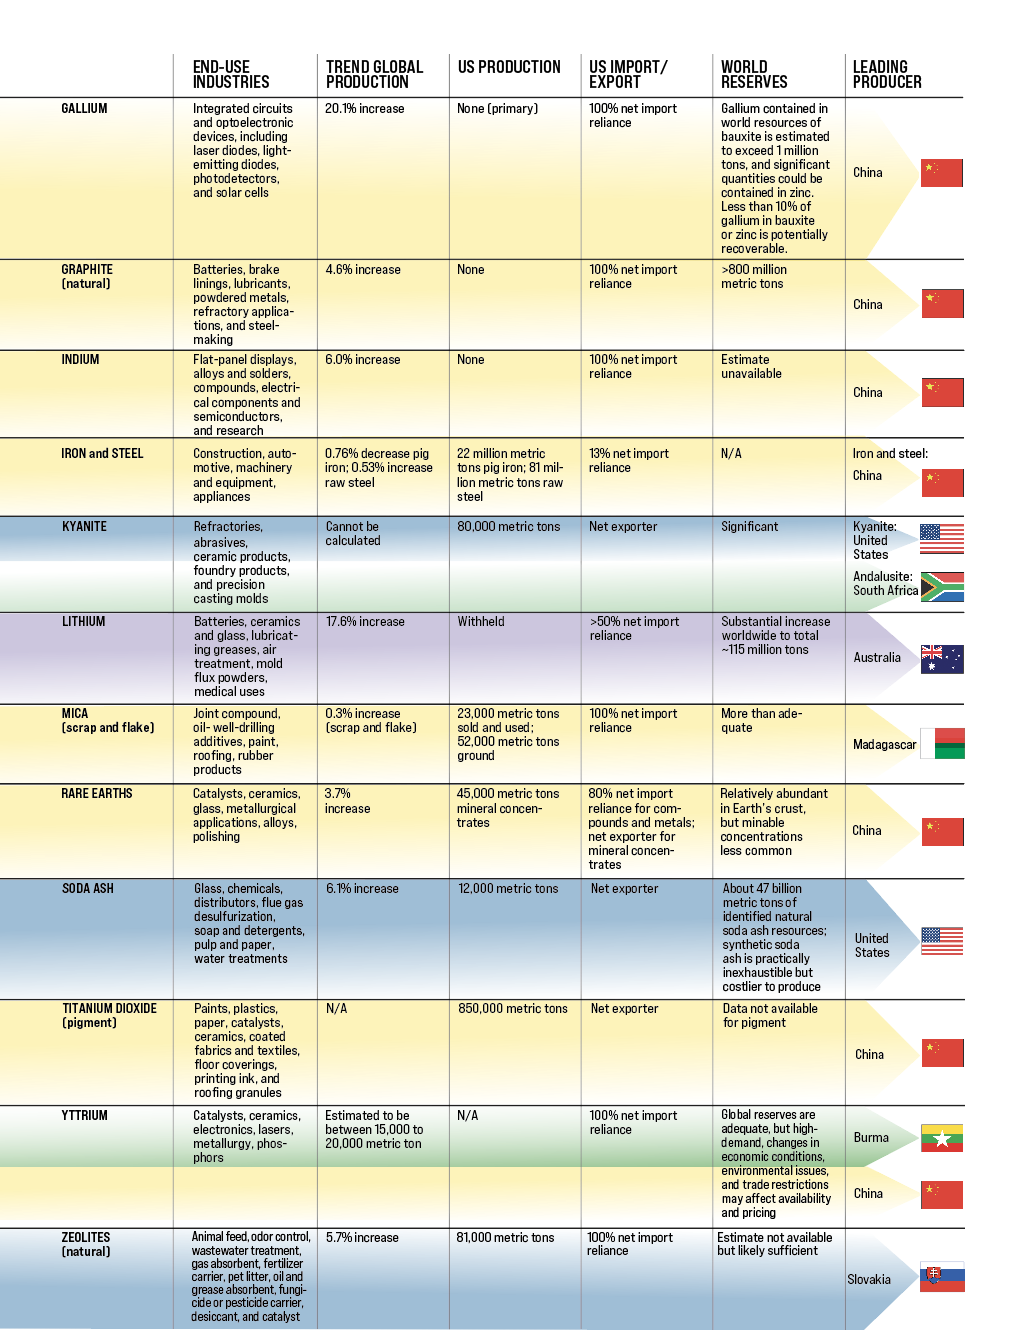
The table below summarizes some of the statistics and trends for a variety of mineral commodities that serve the ceramic and glass industries. Access the complete USGS report at https://doi.org/10.3133/mcs2025.


Related Articles

Market Insights
The evolving discipline of demand forecasting can improve competitiveness and control costs
What does the future hold? It is a question that everyone has contemplated at one time or another, and a mystery that has obsessed writers, mystics, philosophers, clerics, astrologers, and others for centuries. For businesses, the question is more than philosophical. Discovering clues to what is next is essential to…

Bulletin Features
Sustainable ceramics production: Environmental considerations in tile manufacturing
Ceramics are often regarded as a sustainable material choice thanks to their high durability and chemical stability, which enable a long service life. But ceramics come with environmental baggage in other areas, such as raw material sourcing, processing, and disposal. The specifics of this baggage are unique to each ceramic…

Market Insights
Financing the responsible supply of energy transition minerals for sustainable development
As the world transitions to sustainable development and the achievement of net-zero emissions by 2050, the demand for specific minerals and metals, such as lithium, nickel, and copper, is surging. These minerals are crucial for the development of batteries, solar panels, and electric vehicles, and therefore are central to clean…